
- Home
- Getting Started
- Documentation
- Release Notes
- Tour the Interface
- Tour the Layers
- JMARS Video Tutorials
- Lat/Lon Grid Layer
- Map Scalebar
- Nomenclature
- Crater Counting
- 3D
- Shape Layer
- Mosaics
- Map
- Advanced/Custom Maps
- Graphic/Numeric Maps
- Custom Map Sharing
- Stamp
- THEMIS
- MOC
- Viking
- CRISM Stamp Layer
- CTX
- HiRise
- HiRISE Anaglyph
- HiRISE DTM
- HRSC
- OMEGA
- Region of Interest
- TES
- THEMIS Planning
- Investigate Layer
- Landing Site Layer
- Tutorials
- Video Tutorials
- Displaying the Main View in 3D
- Finding THEMIS Observation Opportunities
- Submitting a THEMIS Region of Interest
- Loading a Custom Map
- Viewing TES Data in JMARS
- Using the Shape Layer
- Shape Layer: Intersect, Merge, and Subtract polygons from each other
- Shape Layer: Ellipse Drawing
- Shape Layer: Selecting a non-default column for circle-radius
- Shape Layer: Selecting a non-default column for fill-color
- Shape Layer: Add a Map Sampling Column
- Shape Layer: Adding a new color column based on the values of a radius column
- Shape Layer: Using Expressions
- Using JMARS for MSIP
- Introduction to SHARAD Radargrams
- Creating Numeric Maps
- Proxy/Firewall
- JMARS Shortcut Keys
- JMARS Data Submission
- FAQ
- Open Source
- References
- Social Media
- Podcasts/Demos
- Download JMARS
Shape Layer
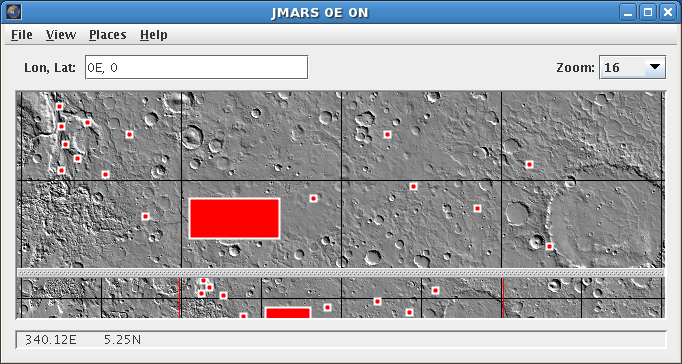
The Shape Layer, which is available in the THEMIS and MRO releases of JMARS, allows users to create and view files containing points and regions of interest. This layer is similar to the Region of Interest (ROI), except that it only allows users to specify geographical regions or locations without observation information and must be saved to a file rather than to a JMARS database.
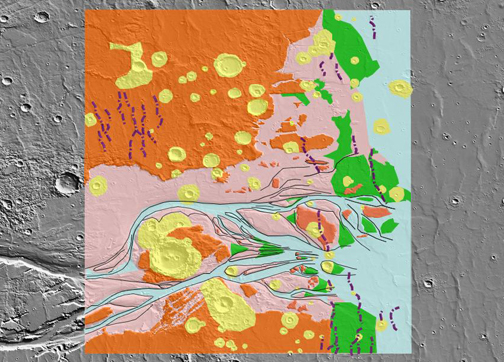
Example map created with JMARS shape layer. Credit: Sarah Gelman (MIT, Caltech SURF Program)
Open the Shape Layer
- Open the Shape Layer: Chose "Add New Layer" -> "Shapes"
- Load a Shape File: At the top of the Shape Layer focus panel, click "File" -> "Load File". Select the desired shape file and click "Load".
Loading a Shape File
JMARS supports several popular shapefile formats. The restrictions of these formats are described here.
ESRI shapefile
ESRI shapefiles consist of a .shp, .shx, and .dbf file. To load a shapefile in JMARS, go to the File menu in the shape layer, and choose Load, change the file type to Shapefile, and find the .shp file in your file system. Multiple shp files may be selected at one time.
JMARS does not currently support map projected coordinates, x/y/z coordinates, multi-polygons, or polygons with holes in them. Simple shapes with coordinates represented by east longitude and geocentric latitude are required.
CSV
A csv file is a simple comma-separated text file, typically exported from a spreadsheet program like Microsoft Excel. It can represent point data and any number of additional columns of metadata.
When loading a file, the csv reader in JMARS will look for a 'lon' or 'longitude' column, and a 'lat' or 'latitude' column. The usage of these columns is affected by optional header comments, but the default is to interpret the longitude values as degrees east of the prime meridian, and the latitude values as geocentric latitude north of the equator.
Header comments begin with a '#' symbol and should be placed at the top of the csv file. They allow customizing how to interpret the longitude and latitude values.
If the latitude values you are exporting are geographic, you must specify the radii of the datum for JMARS to understand their position on the map. To specify an ellipsoid, the radii must be provided as header keywords. The A/B/C radii keywords are accepted due to their similarity with PDS / ISIS images, but be certain A and B radii are equal. The polar and equatorial radii may also be specified directly as shown below. Both types of radii keywords should not be used. A typical example set of Mars radii:
# A_AXIS_RADIUS = 3396.1900000
# B_AXIS_RADIUS = 3396.1900000
# C_AXIS_RADIUS = 3376.2000000
OR
# EQUAT_RADIUS = 3396.19
# POLAR_RADIUS = 3376.20
The default interpretation of longitude values is degrees east of the prime meridian. To specify degrees west of the prime meridian, a header keyword may be added, as shown here:
# LONGITUDE_DIRECTION = WEST
OR
# LON_DIR = W
JMARS will attempt to guess the types of all other columns. If a column contains only numbers, it will assume it is a numeric column. If a column contains only 'true' or 'false', it will assume it is a boolean column. All other columns will be loaded into the shape layer as string columns.
Creating a Shape File
- Change to Add Mode: Right-click in the Main View and choose which feature type you would like to add from the list.
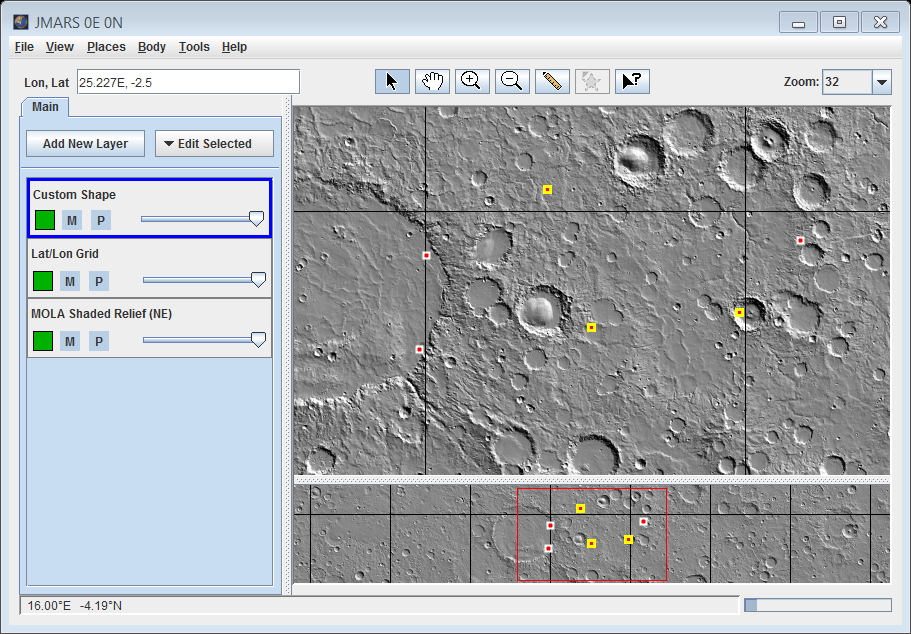
- Add a Point: Double-click on the location in the Main View where you want a point located.
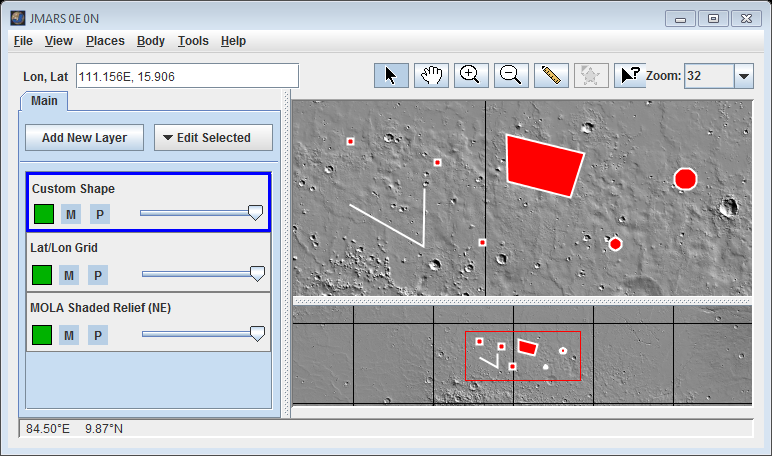
- By default, the point will show up as a white square with a red center. This indicates that it's a stand-alone point and not a corner-point of a polygon.
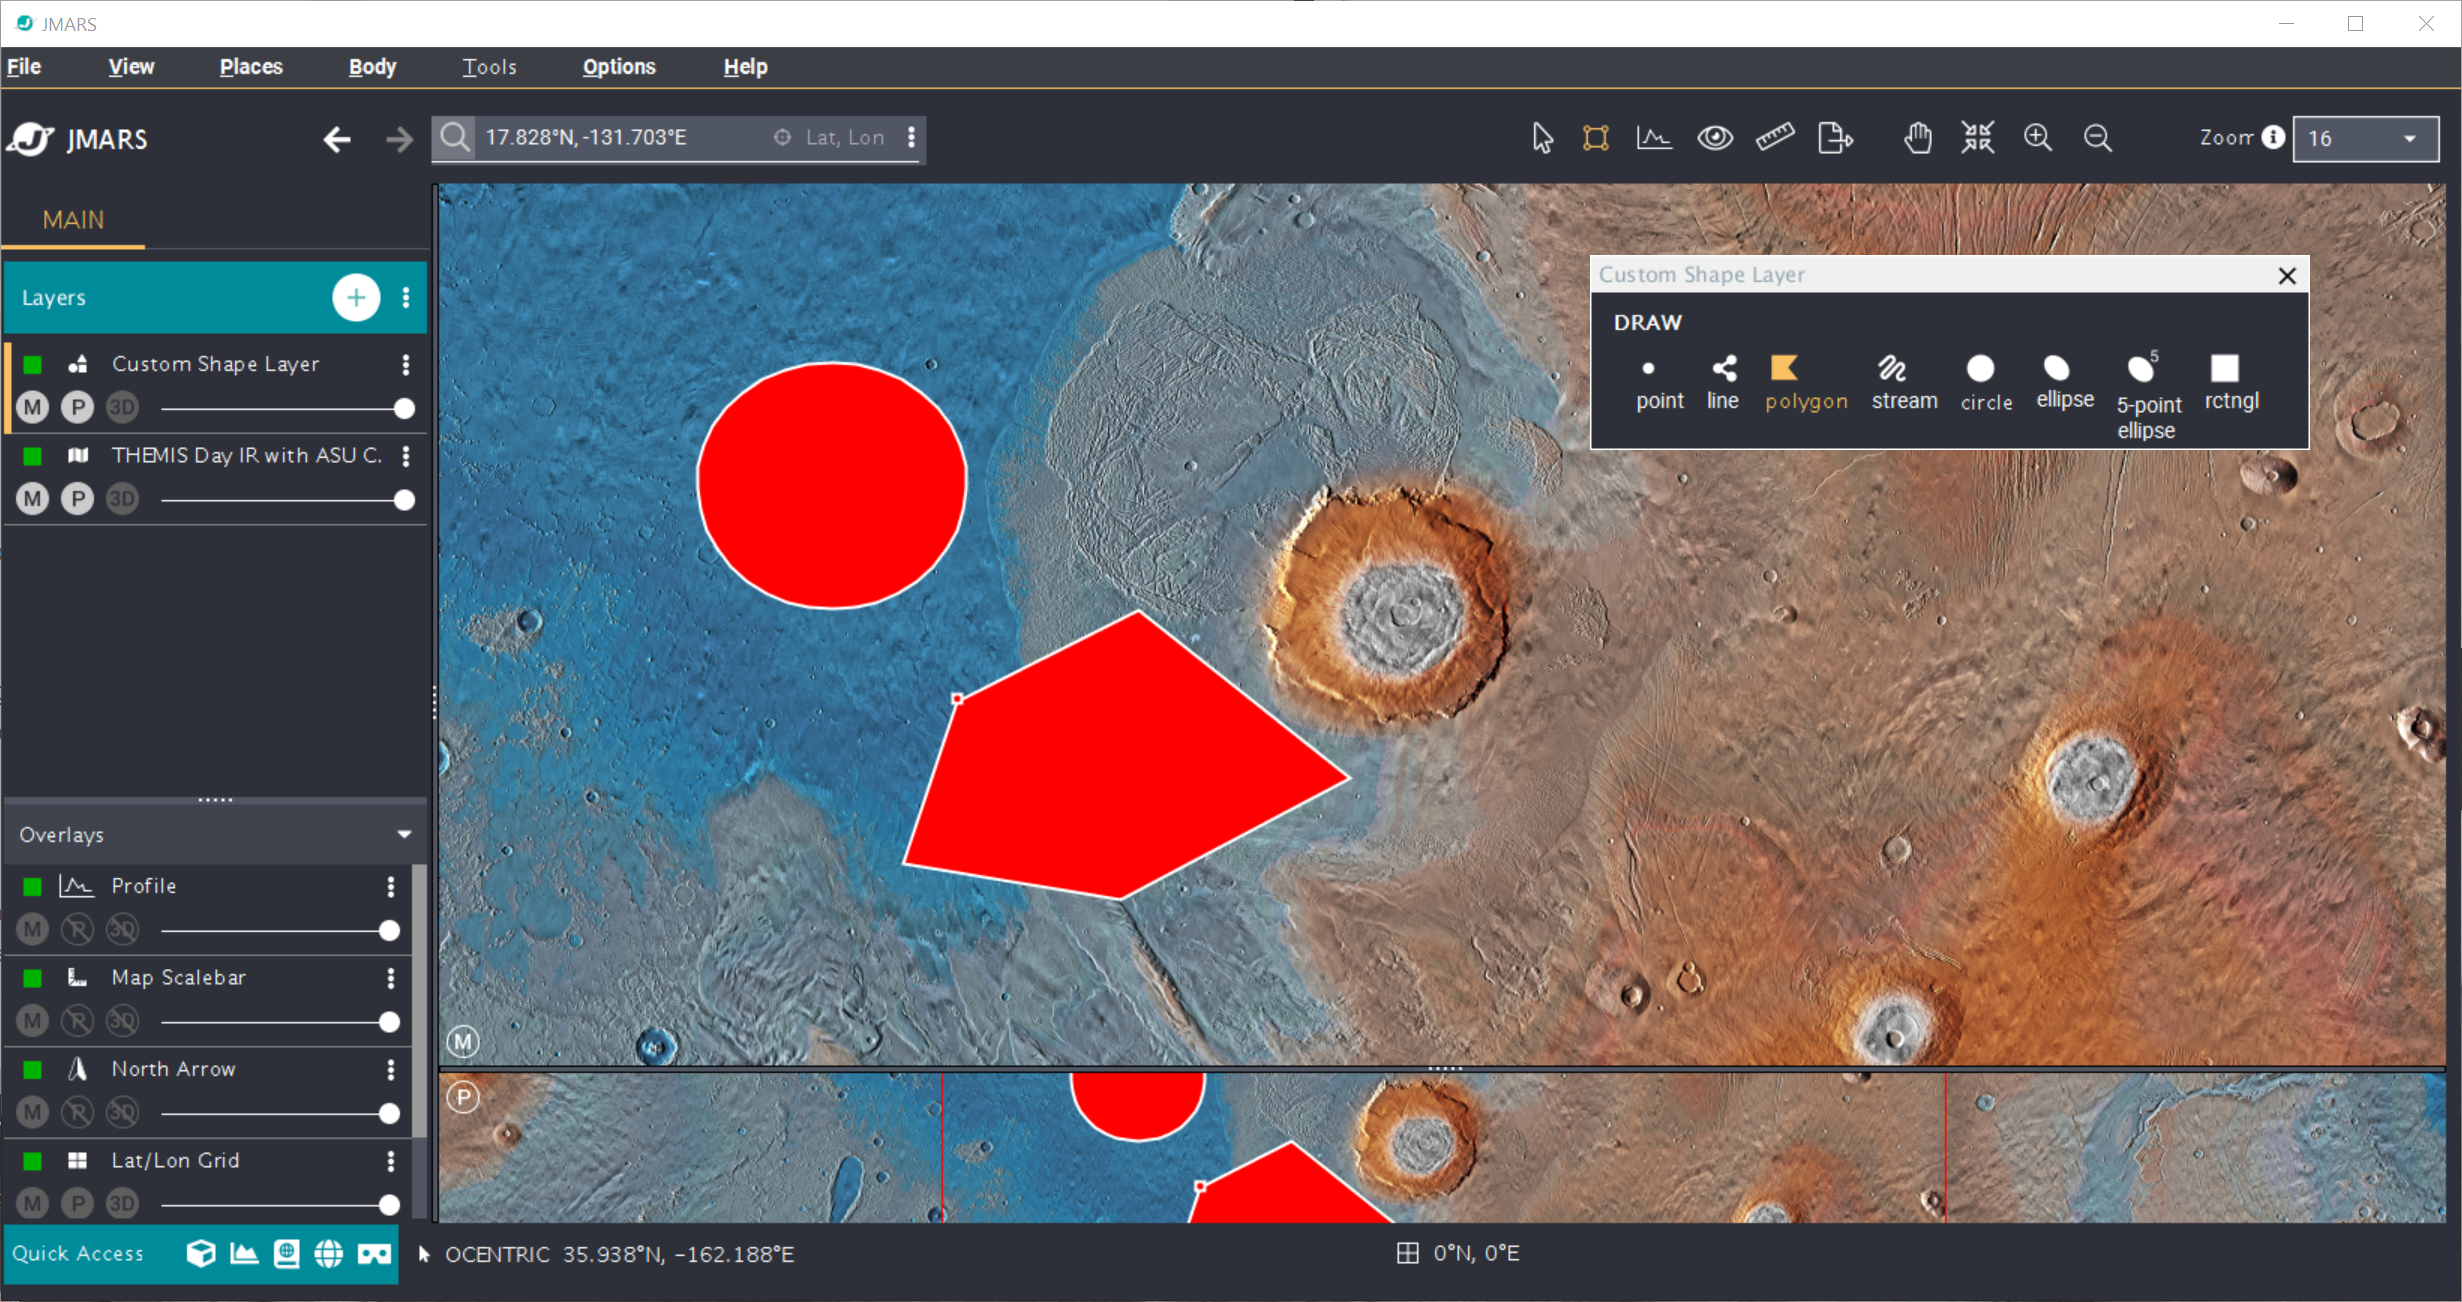
- Adding a Polygon: Click on a location in the Main View where you want one of the polygon corners located.
Then move to the next corner location and click again. To finish the polygon, click on the first point to close
the shape.
- By default, the polygon will show up as a white outline will a red fill color.
- Adding a Polyline: Click on a location in the Main View where you want to start the line, then move to the next point of the polyline (non-linear line) and single-click to add a new point. When you reach the end, double-click to create the last point.
- Saving the Shape File: At the top of the Shape Layer focus panel, click "Feature" -> "Save All
Features As". Specify a location, file name and file type and then click on "Save".
- For new users, the ESRI file format is recommended.
Editting a Point/Polygon
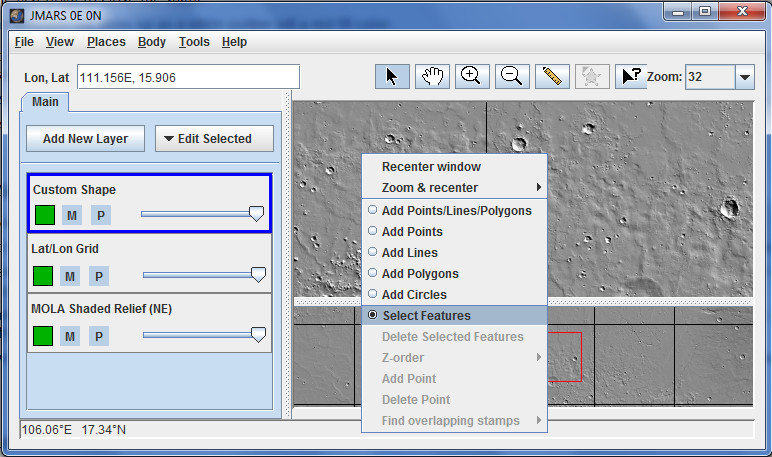
- Change to Edit Mode: Right-click in the Main View and chose "Select Features"
- Edit a Point: Select a point by clicking on it. (It should now be highlighted in yellow.) Left-click on the point and drag it to a new location.
- Edit a Polygon: Select a corner point by clicking on it. (It should now be highlighted in yellow.) To move the corner point, left-click and drag it to a new location. To add a new corner point, left-click on a line, chose "Add Point" and then drag the new point to it's final position.
- Edit a Polyline: Similar to editing a polygon, select the line by clicking on it. (It should now be highlighted in yellow.) To move the point, left-click and drag it to a new location. To add a new point, left-click on a line, chose "Add Point" and then drag the new point to it's final position.
- Re-Save the Shape File: At the top of the Shape Layer focus panel, click "Features" -> "Save All Features As". Users can either create a new shape file or overwrite the existing shape file.
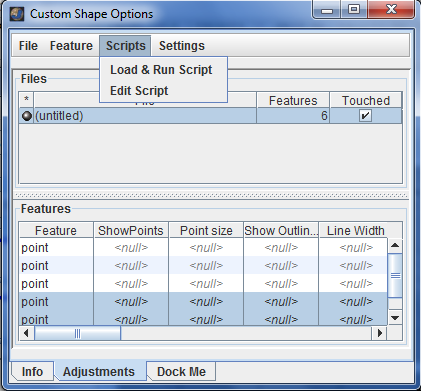
Editting the Shape Layer Columns
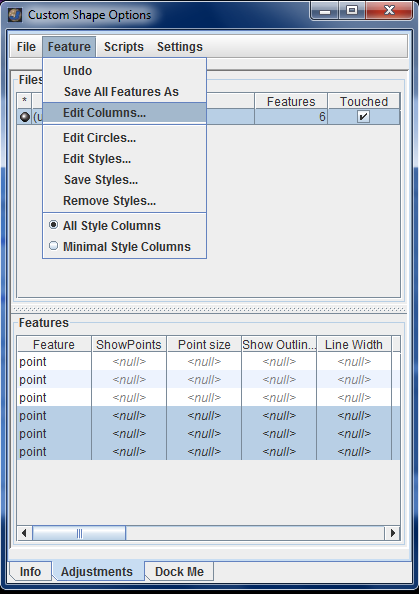
- The properties of each object currently loaded in the Shape Layer (points, polylines and polygons) are shown in the "Features" table of the focus panel. By default, the only columns visible are the basic display parameters of each object.
- Open the Column Editor: In the "Shape Layer" focus panel, click the "Adjustment" tab -> "Feature" -> "Edit Columns"
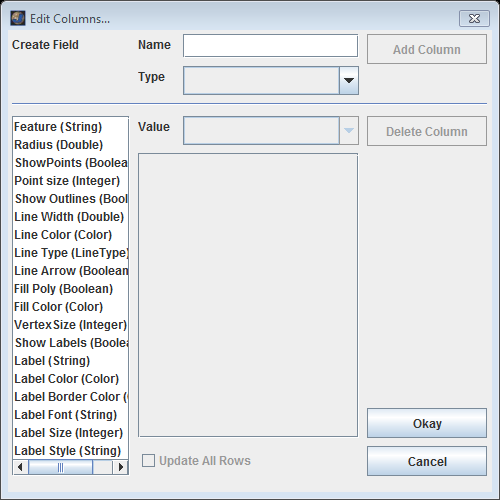
- Delete Existing Columns: All of the existing columns in the focus panel table are displayed in the
left-hand box.
- Edit the Shape Layer Settings: At the bottom of the Shape Layer focus panel, click on "Adjustments" tab -> right click "Feature" -> "Edit Styles" to
open the Settings Window.
- Shape Layer Name: This field allows users to change the name of the shape layer, which will be reflected in the Layer Manager.
- Edit the Shape Layer Settings: At the bottom of the Shape Layer focus panel, click on "Adjustments" tab -> right click "Feature" -> "Edit Styles" to
open the Settings Window.
Writing Shape Layer Scripts
Users can write simple scripts to automatically edit the parameters of the various features in a shape file, which is especially useful when a file has a large number of features in it. The command language is similar to SQL, but has many differences:
- Color columns are specified by a color_spec (e.g. color(255,255,255) ). The order of the elements in a "color spec" are color( red, green, blue). The colors must be an integer between 0 and 255, inclusive.
- Selecting anything other than the entire row is undefined. Therefore, selection must be preceeded by the string "select rows" or "select *".
- An "update set" query changes the column to the specified value in all the rows selected by the predicate.
- A "move rows" query will move all the rows specified in a where clause by the specified delta .
The following are some basic instructions for getting started. For more information on writing and applying shape layer scripts, read the Using the Shape Layer tutorial.
- Open a New Script: At the top of the Shape Layer focus panel, chose "Scripts" -> "Edit Script". A blank pop-up window will open.
- Write a Script: A script will have three components: an operation, an instruction and a set of
rows where the operation will be applied.
- Operations: An SQL-type command such as "update", "select" or "move".
- Instructions: An SQL-type command such as "set[field1]=XXX"
- Set of Rows: An SQL-type specification such as "where field2 like 'XXXXX'"
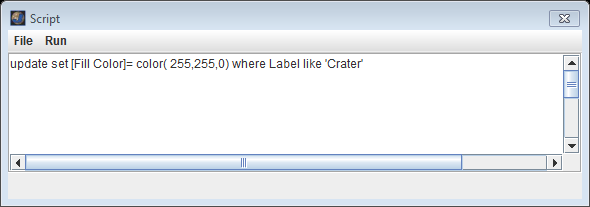
- Examples:
- update set [Fill Color]= color( 255,255,0) where Label like 'Crater'
- changes the fill color to yellow in every row that has a label which consists of the single word "Crater"
- update set PERIMETER = AREA + 100
- sets the value of the perimeter column to that of the area column plus 100 in all rows
- select rows where AREA > 50.00
- turns selection on in all the rows where the Area column has a value greater than 50
- move rows (0.0, 1.0) where lon > 0
- moves all the rows with center longitudes greater than zero 1 degree up