- Home
- Getting Started
- Documentation
- Release Notes
- Tour the Interface
- Tour the Layers
- JMARS Video Tutorials
- Lat/Lon Grid Layer
- Map Scalebar
- Nomenclature
- Crater Counting
- 3D
- Shape Layer
- Mosaics
- Map
- Advanced/Custom Maps
- Graphic/Numeric Maps
- Custom Map Sharing
- Stamp
- THEMIS
- MOC
- Viking
- CRISM Stamp Layer
- CTX
- HiRise
- HiRISE Anaglyph
- HiRISE DTM
- HRSC
- OMEGA
- Region of Interest
- TES
- THEMIS Planning
- Investigate Layer
- Landing Site Layer
- Tutorials
- Video Tutorials
- Displaying the Main View in 3D
- Finding THEMIS Observation Opportunities
- Submitting a THEMIS Region of Interest
- Loading a Custom Map
- Viewing TES Data in JMARS
- Using the Shape Layer
- Shape Layer: Intersect, Merge, and Subtract polygons from each other
- Shape Layer: Ellipse Drawing
- Shape Layer: Selecting a non-default column for circle-radius
- Shape Layer: Selecting a non-default column for fill-color
- Shape Layer: Add a Map Sampling Column
- Shape Layer: Adding a new color column based on the values of a radius column
- Shape Layer: Using Expressions
- Using JMARS for MSIP
- Introduction to SHARAD Radargrams
- Creating Numeric Maps
- Proxy/Firewall
- JMARS Shortcut Keys
- JMARS Data Submission
- FAQ
- Open Source
- References
- Social Media
- Podcasts/Demos
- Download JMARS
Investigate Tool and Layer
The Investigate Layer has been further developed in the Beta Version of JMARS. It shows all of the data under the mouse pointer in two different styles. The first style is a list view which shows a list of the different layers under the mouse. The second is a chart style. If the Layers have data, the chart will represent each layers data at that point.
How to use it
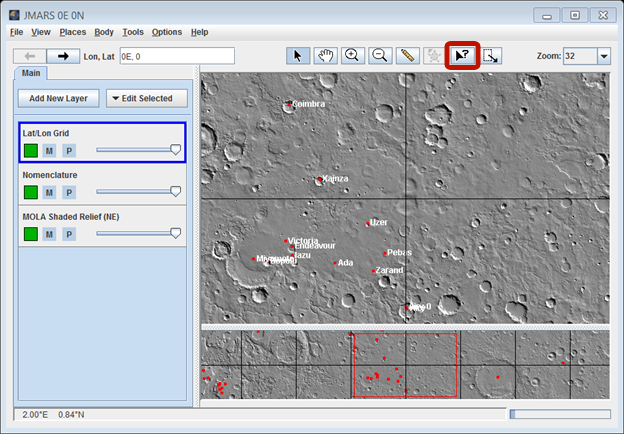
- Locate the Toolbar at the top of JMARS, then Click the Investigate Layer. A new Layer should be added to your Layer Manager called "Investigate Layer".
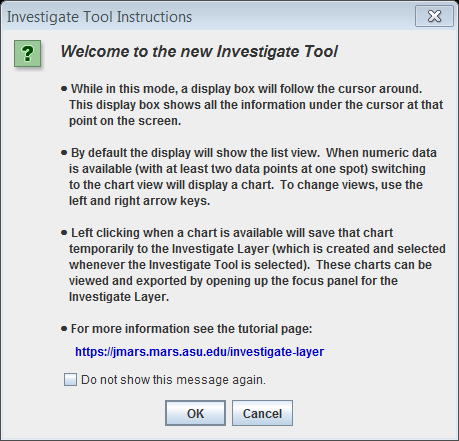
- The first time you click on the Investigate Tool, an Instruction window will pop up. You can click the check box if you don't want to see this message anymore but please read it before you do so. It has valuable tool information inside.
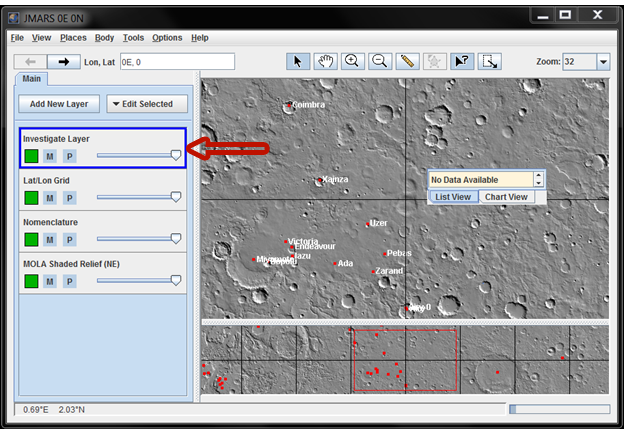
- If your Investigate layer is selected in the Layer Manager (if it is outlined in blue), you will need to also make sure the Investigate Tool in the tool bar is selected. Now you can bring your mouse to the Main View. You will notice a box that follows your mouse around. The default is in list view. If you don't have any layers loaded with data then your list view should say "No Data Available."
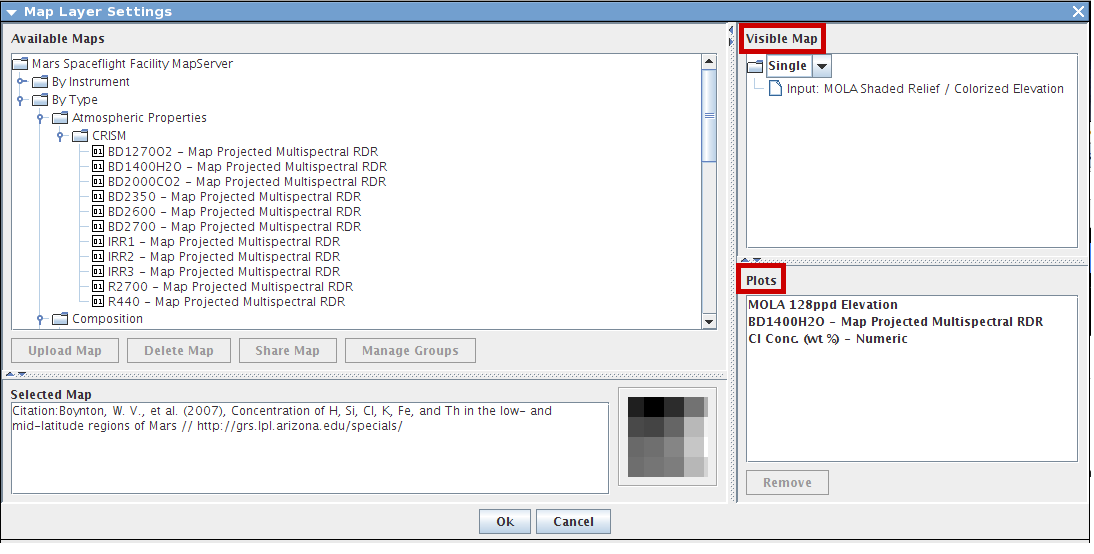
- You can load data several ways. The investigate tool recognizes numeric data therefore you can add the data separately through the "Add New Layer" or you can go into "Advanced Maps" under "Add New Layer". Below is an example of loading multiple numeric data sets into one single plot.
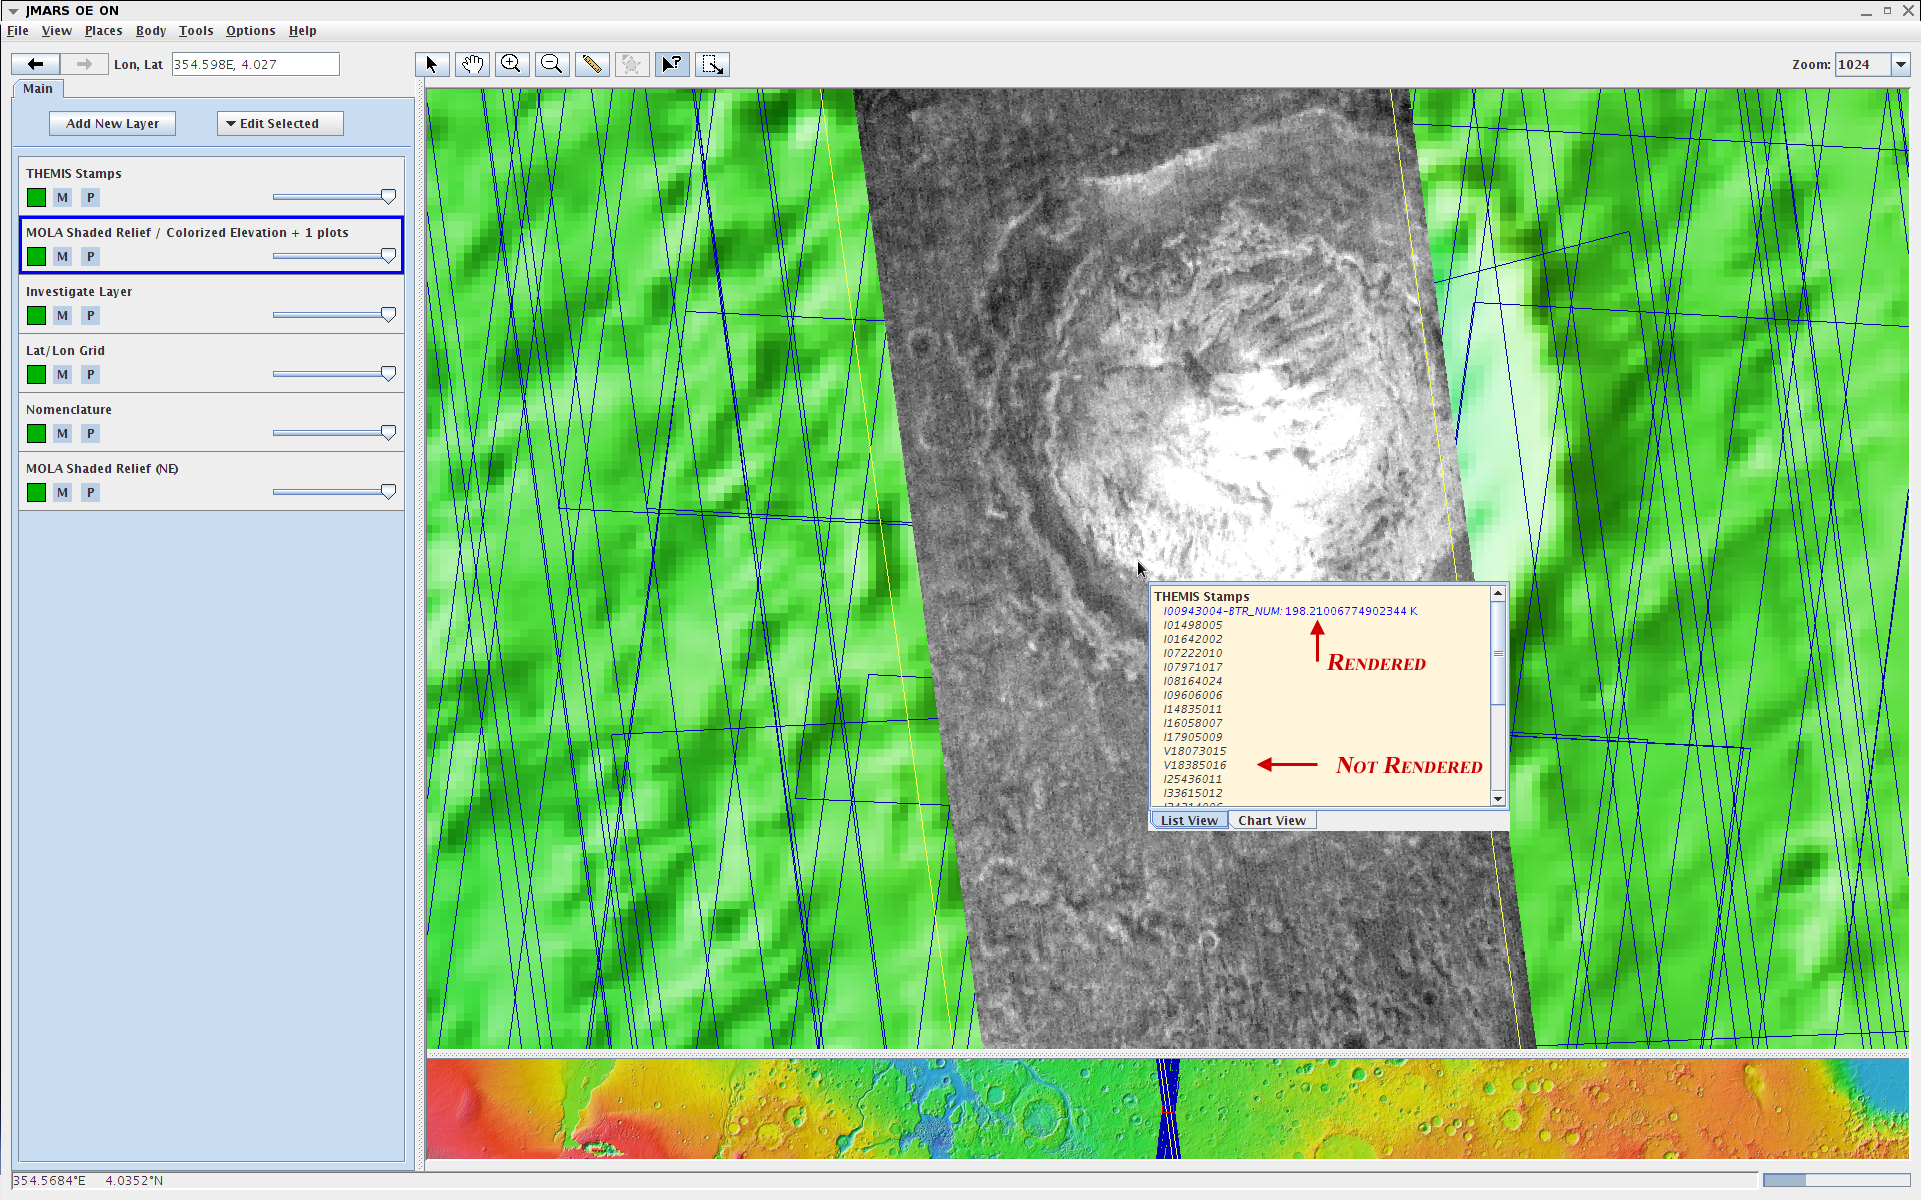
- After you have loaded your data, you will see that the Investigate tool shows the layers name along with the values at every point. If you have any stamps loaded, you may notice that there are stamps listed in the LIst view that are blue and black. The blue stamps are the stamps that are rendered while the stamp titles written in black are not rendered.
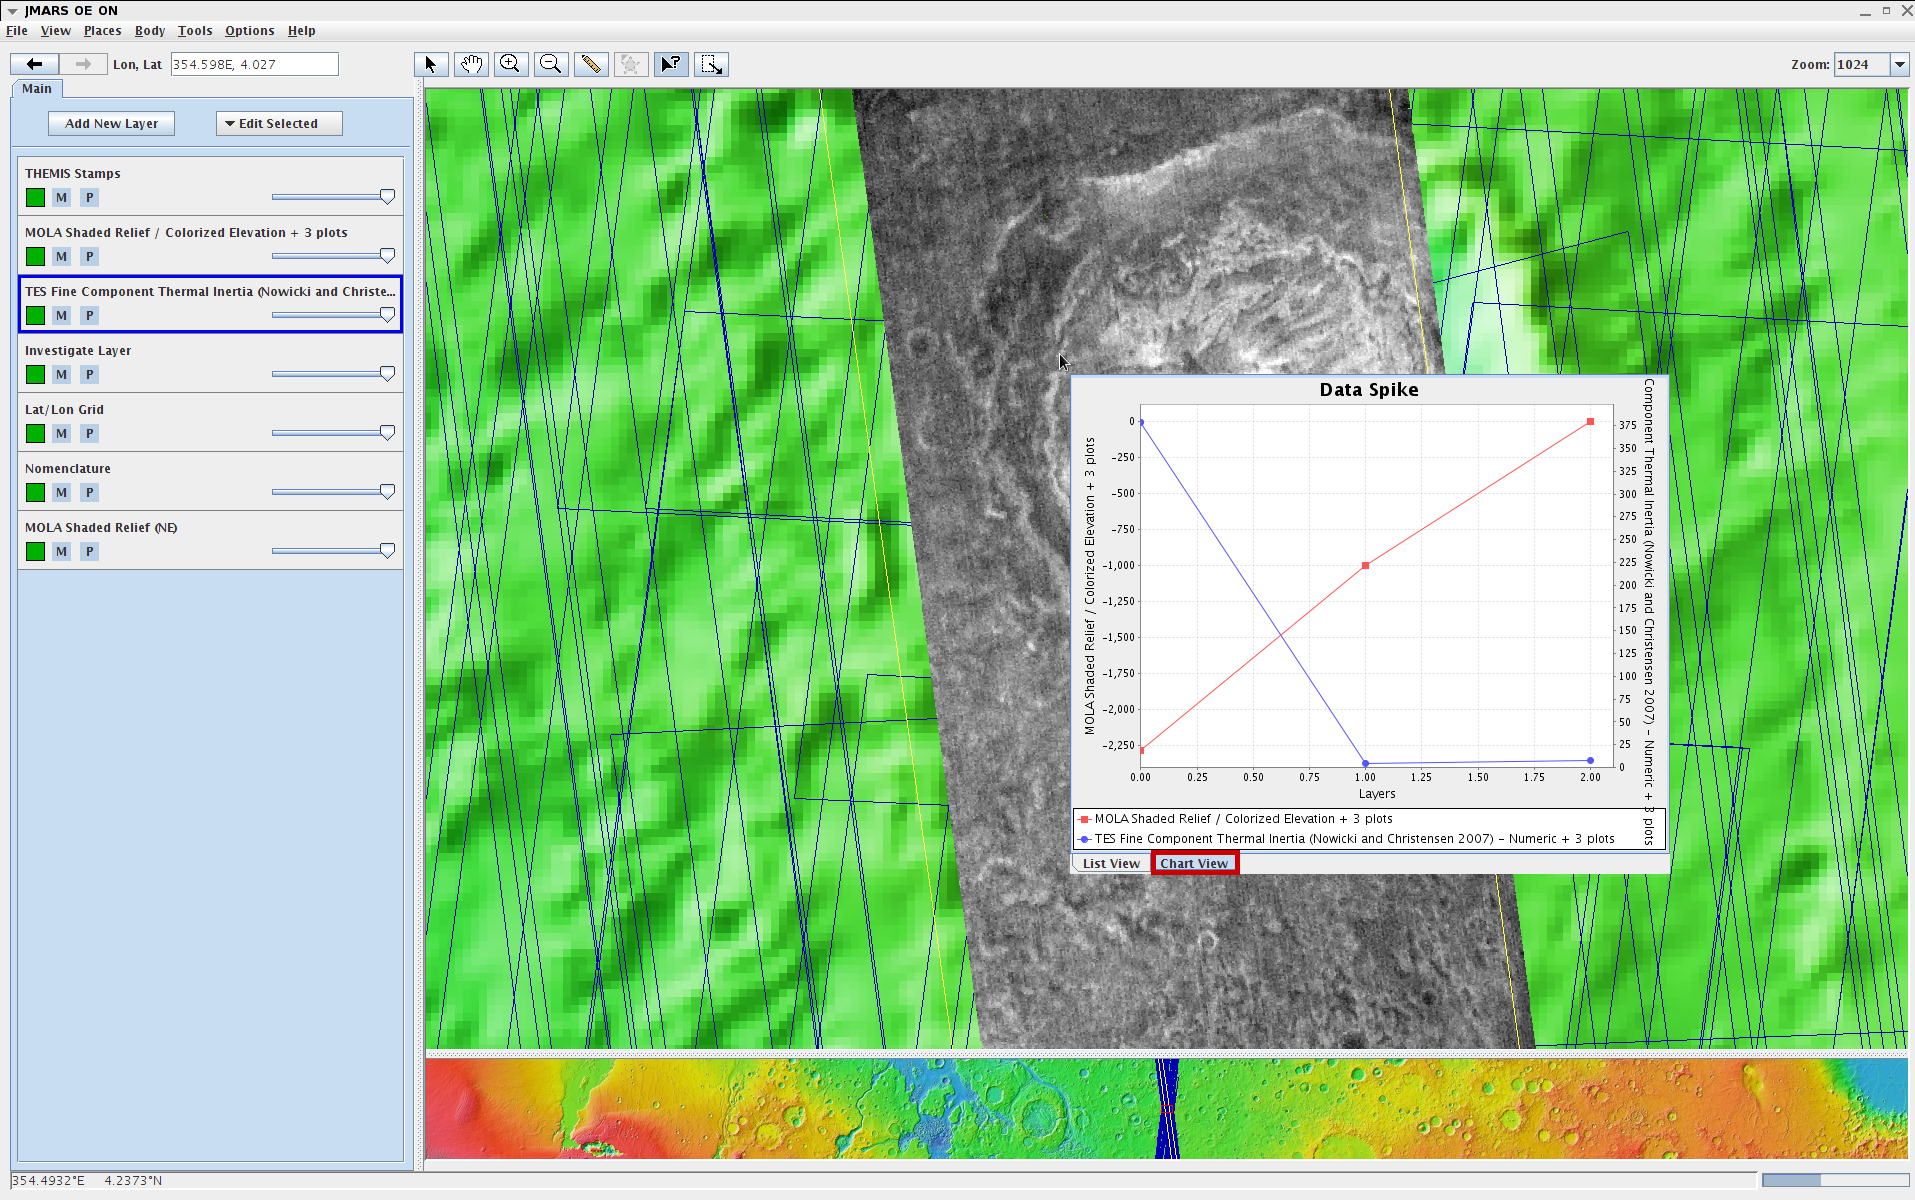
- When you have numeric data in your list View, you can press the right arrow key to view the data in a chart.
- The data chart will show the layers that you have present for each plot. Each numeric Layer in the Plot is represented at whole numbers along the x-axis.This example has two different plots but both have 3 different numeric layers inside A legend below the plotted chart shows which plot is which color. To save the chart, left click when the chart is being shown. This will temporarily save the chart in your Investigate Layer. Make sure the saved names are unique. You can't save multiple charts with the same data spike name. To see the chart again and change the properties, double click the Investigate Layer and click the tab with the name you saved the chart under.
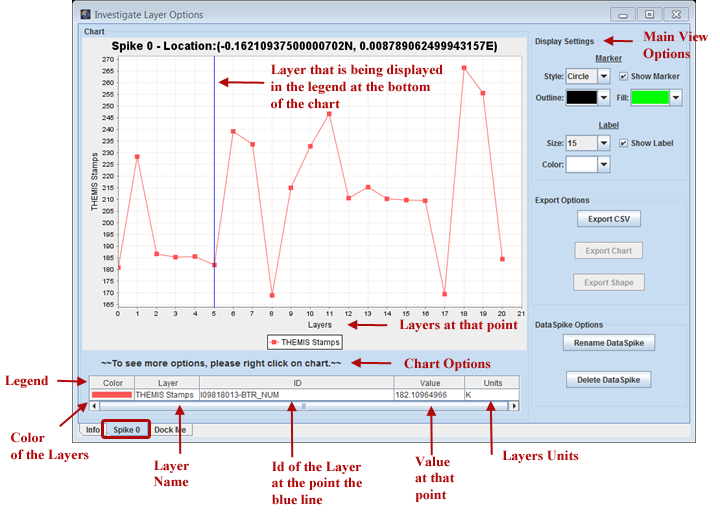
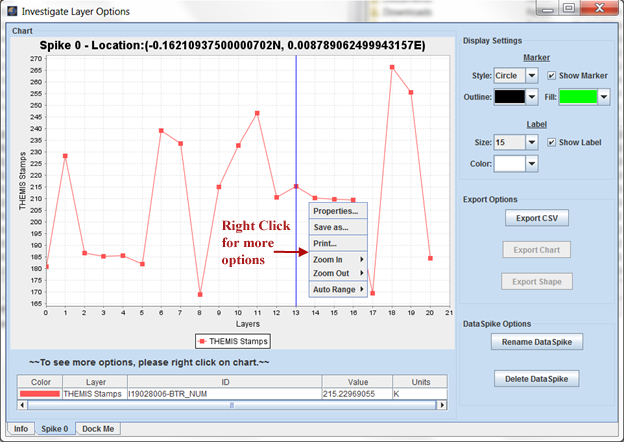
- To see more Chart Options, click the right mouse button on the Chart. If you go into Properties, you can change the charts look and feel.
- When you save a Chart, you may notice that there is a dot on your main view that shows where that data spike was taken from. The "Display Settings" under the chart allow you to make changes to the Label.