
- Home
- Getting Started
- Documentation
- Release Notes
- Tour the Interface
- Tour the Layers
- JMARS Video Tutorials
- Lat/Lon Grid Layer
- Map Scalebar
- Nomenclature
- Crater Counting
- 3D
- Shape Layer
- Mosaics
- Map
- Advanced/Custom Maps
- Graphic/Numeric Maps
- Custom Map Sharing
- Stamp
- THEMIS
- MOC
- Viking
- CRISM Stamp Layer
- CTX
- HiRise
- HiRISE Anaglyph
- HiRISE DTM
- HRSC
- OMEGA
- Region of Interest
- TES
- THEMIS Planning
- Investigate Layer
- Landing Site Layer
- Tutorials
- Video Tutorials
- Displaying the Main View in 3D
- Finding THEMIS Observation Opportunities
- Submitting a THEMIS Region of Interest
- Loading a Custom Map
- Viewing TES Data in JMARS
- Using the Shape Layer
- Shape Layer: Intersect, Merge, and Subtract polygons from each other
- Shape Layer: Ellipse Drawing
- Shape Layer: Selecting a non-default column for circle-radius
- Shape Layer: Selecting a non-default column for fill-color
- Shape Layer: Add a Map Sampling Column
- Shape Layer: Adding a new color column based on the values of a radius column
- Shape Layer: Using Expressions
- Using JMARS for MSIP
- Introduction to SHARAD Radargrams
- Creating Numeric Maps
- Proxy/Firewall
- JMARS Shortcut Keys
- JMARS Data Submission
- FAQ
- Open Source
- References
- Social Media
- Podcasts/Demos
- Download JMARS
3D Layer
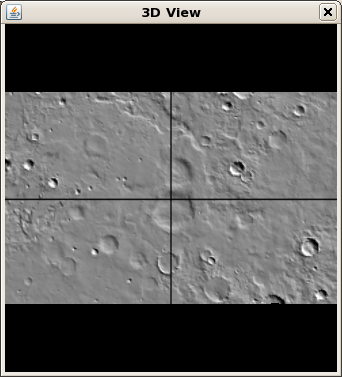
The 3D Layer is unlike many of the JMARS layers because it does not load any visual data into the Viewing Window. Instead, it opens a new window and displays a three-dimensional version of the scene in the Main View. This allows the user to observe the altitude of the terrain directly, instead of relying on the shadowing of the 2D maps to determine the height or depth of certain features. The 3D Layer is available in the THEMIS and Public releases of JMARS.
Navigating in the 3D Layer
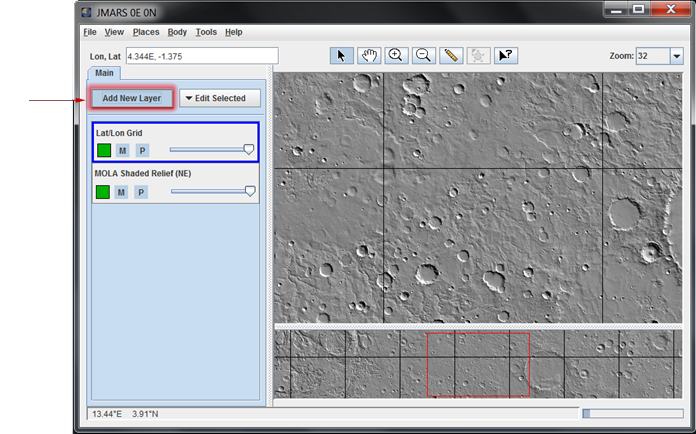
- Display a Map in the Viewing Window: Before loading the 3D Layer, the user must display a graphical map in the Viewing Window. Users can also display the Lat/Lon Grid Layer, the Groundtrack Layer, the THEMIS Planning Layer or any other layer which draws visible data in the Viewing Window.
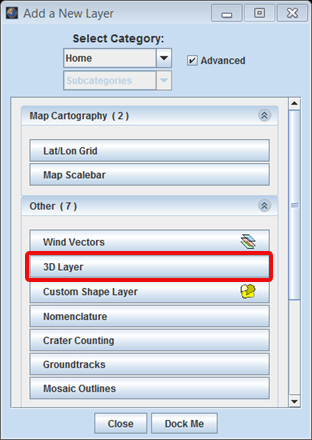
- Open the 3D Layer: Chose "Add New Layer" -> "3D Layer"
- Navigate in the View: Using the following mouse and keyboard controls, the user is able to navigate in the 3D Layer's window:
- Drag Left Mouse Button: Rotate X/Y
- Shift+Drag Left Mouse Button: Translate X/Y
- Drag Right Mouse Button: Rotate Z
- Shift+Drag Right Mouse Button: Zoom
- Drag Middle Mouse Button: Zoom
- The W Key: moves the image along the surface upwards.
- The A Key: moves the image along the surface to the left.
- The S Key: moves the image downwards.
- The D Key: moves the image along the surface to the right.
- Reset the 3D View: If the area displayed in the Main View is changed, the area in the 3D View will not automatically change. Clicking the "Reset Camera" button in the 3D Layer focus panel will refresh the 3D View to match the Main View.
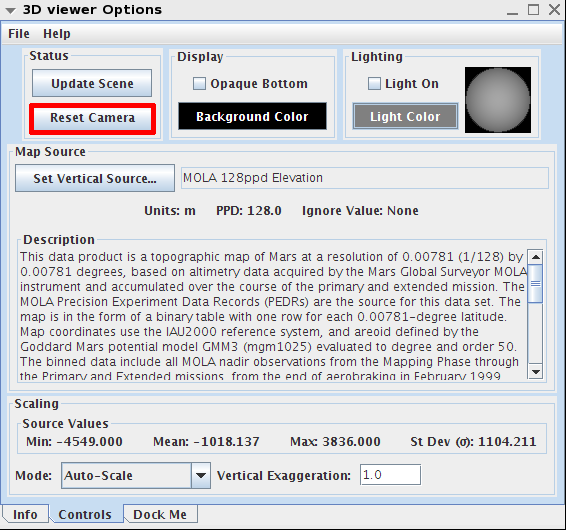
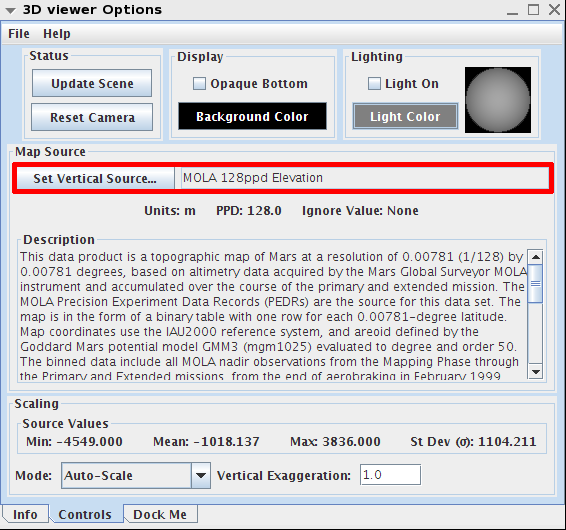
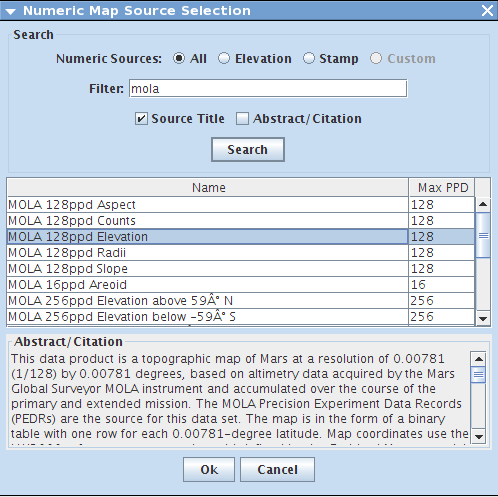
- Select the map source: Click the "Set Vertical Source" button to to get an additional dialog window. You can select the map you would like to use as your source from the new dialog window. Try using the "Search" area to find your map faster.
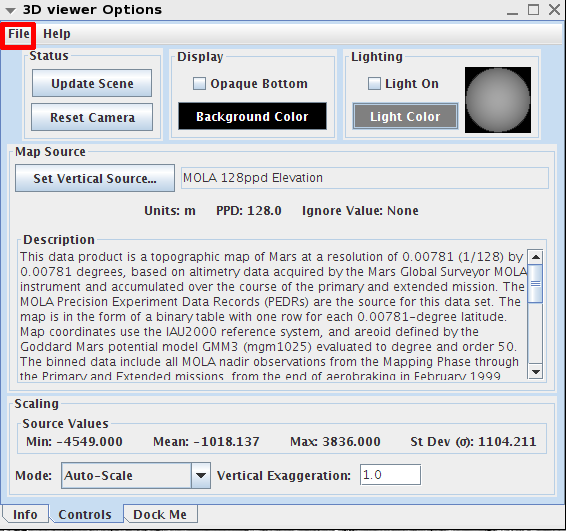
Creating a 3D Printer File
- Once you have your 3D Layer window open with your map source and settings complete, you can export a 3D printer file. Press the "File" menu on the 3D viewer option. Then select "Save 3D Printer File"
- Create a name and location for the file (it saves as an stl file)
Changing the 3D Layer Settings
- Display the Focus Panel: At the top of the Layer Manager, click on the "3D Viewer" tab.
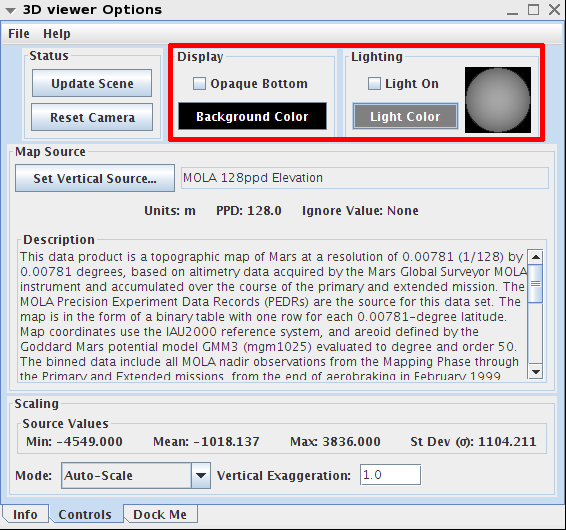
- Scene Properties: The scene properties control the appearance of the surface displayed in the 3D Window.
- Bottom: Selecting this option will apply a color to the bottom of the 3D surface in the 3D window. This makes it easier to make sure the user is viewing the top of the surface instead of the bottom.
- Update Scene: If the position of the Main View has changed, click this button to refresh the view displayed in the 3D window.
- Z Scale: This option allows the user to exaggerate the altitudes displayed in the 3D window, which is particularly useful when displaying relatively flat terrain. By default, the elevation (z-axis) has a scaling multiplier of 1.0. To change this value simply change the multiplier and click "Update Scene".
- Altitude: This option allows users to display altitude data from different sources. The default source is the MOLA altitude data.
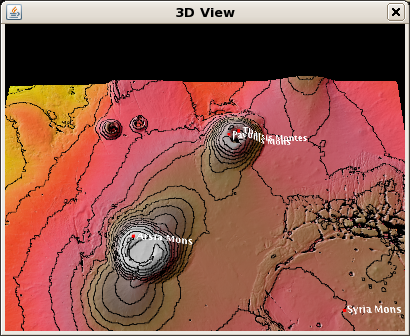
3D view with Z Scale = 2
- Orientation: This section of the focus panel allows the user to control and modify the view in the "3D View" Window.
- Directional Light: This section of the focus panel gives users the ability to add an artificial light
source to the 3D window in order the change the appearance of shadows on the 3D terrain.
- Light On: This check-box will turn on the artificial light source. The default setting is off.
- Light Color: This button will give users a color palette from which they can choose the color of the light source.
- Light Source Position: The lighted circle represents the position of the artificial light source. By default, the light source is positioned directly above the 3D terrain. To change this position, click on the center of the lighted circle and drag it around the box. Release the click to see what the terrain looks like with the light source in the new position.
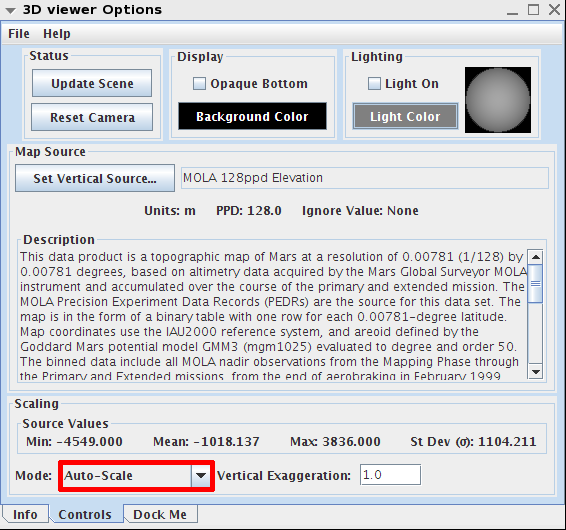
Scaling ModeUnder the "Scaling" section at the bottom of the window, you will find a pull down menu, "Mode"
- Mode: After you load the 3D Layer, double click the Layer in the Layer Manager to see the 3D Viewer Options. Under the "Controls" tab you will see a new option, "Scaling Mode". There are 3 new options:.
- Auto Scaling: Is JMARS way of guessing the appropriate range of the image. Auto scaling automatically scales the data using the radius of Mars. So this option is best used with large ranges of Elevation Change
- Standard Deviation: Uses the Standard Deviation of the dataset to draw the vertical scaling. If the dataset has a small Standard Deviation, the vertical stretch in the 3D Window will be very small. Best used with the Elevation or Numeric sources.
- Range Values: Uses the Max and Min values and excludes the ignore value of the dataset to draw the vertical scaling. Best used with Elevation and Numeric data. NOTE: When using stamps as your elevation source, Zoom in on your main screen to eliminate area that isn't covered by the elevation data.
- Elevation vs Numeric Data, which option to use:
- Elevation Data: If you are loading data with elevation information, try the Auto Scale option first. If this doesn't give you the results you are looking for, try the Range of Values option next. NOTE:When using stamp data as your elevation source, if your stamps have a different range of values, there may be a gap in data. Example below:
- Numeric Data: If you are loading/using Numeric Data use the Standard Deviation option first and then the Range of Values option if you don't get the results you want. The Auto Scaling option automatically scales using the radius of the selected planetary body, therefore, your results may hardly be noticed if you use this option with numeric data.
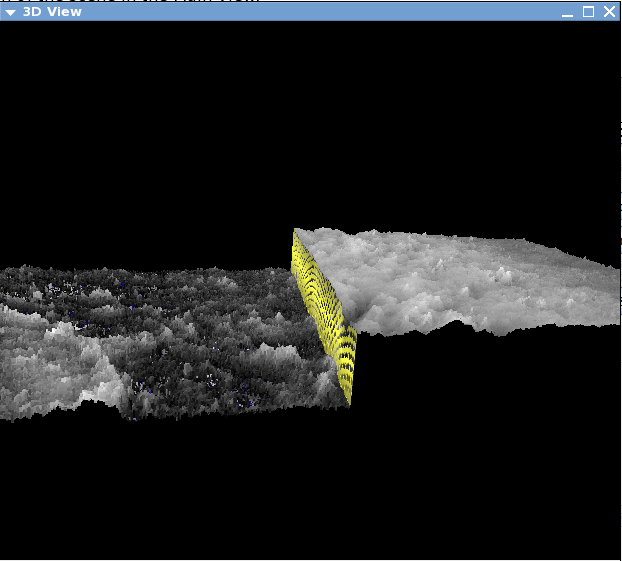
Example: A night time IR stamp and a day time IR THEMIS stamp are both loaded. The range of values differ, therefore, causing a gap in data (shown in yellow).
Video Tutorial: The 3D Layer


Related Pages
- Tutorial #2: Displaying the Main View in 3D