- Home
- Getting Started
- Documentation
- Release Notes
- Tour the Interface
- Tour the Layers
- JMARS Video Tutorials
- Lat/Lon Grid Layer
- Map Scalebar
- Nomenclature
- Crater Counting
- 3D
- Shape Layer
- Mosaics
- Map
- Advanced/Custom Maps
- Graphic/Numeric Maps
- Custom Map Sharing
- Stamp
- THEMIS
- MOC
- Viking
- CRISM Stamp Layer
- CTX
- HiRise
- HiRISE Anaglyph
- HiRISE DTM
- HRSC
- OMEGA
- Region of Interest
- TES
- THEMIS Planning
- Investigate Layer
- Landing Site Layer
- Tutorials
- Video Tutorials
- Displaying the Main View in 3D
- Finding THEMIS Observation Opportunities
- Submitting a THEMIS Region of Interest
- Loading a Custom Map
- Viewing TES Data in JMARS
- Using the Shape Layer
- Shape Layer: Intersect, Merge, and Subtract polygons from each other
- Shape Layer: Ellipse Drawing
- Shape Layer: Selecting a non-default column for circle-radius
- Shape Layer: Selecting a non-default column for fill-color
- Shape Layer: Add a Map Sampling Column
- Shape Layer: Adding a new color column based on the values of a radius column
- Shape Layer: Using Expressions
- Using JMARS for MSIP
- Introduction to SHARAD Radargrams
- Creating Numeric Maps
- Proxy/Firewall
- JMARS Shortcut Keys
- JMARS Data Submission
- FAQ
- Open Source
- References
- Social Media
- Podcasts/Demos
- Download JMARS
JMARS ›
Draw profile lines using numeric data sources
This tutorial will show how you can create profile lines using numeric maps!
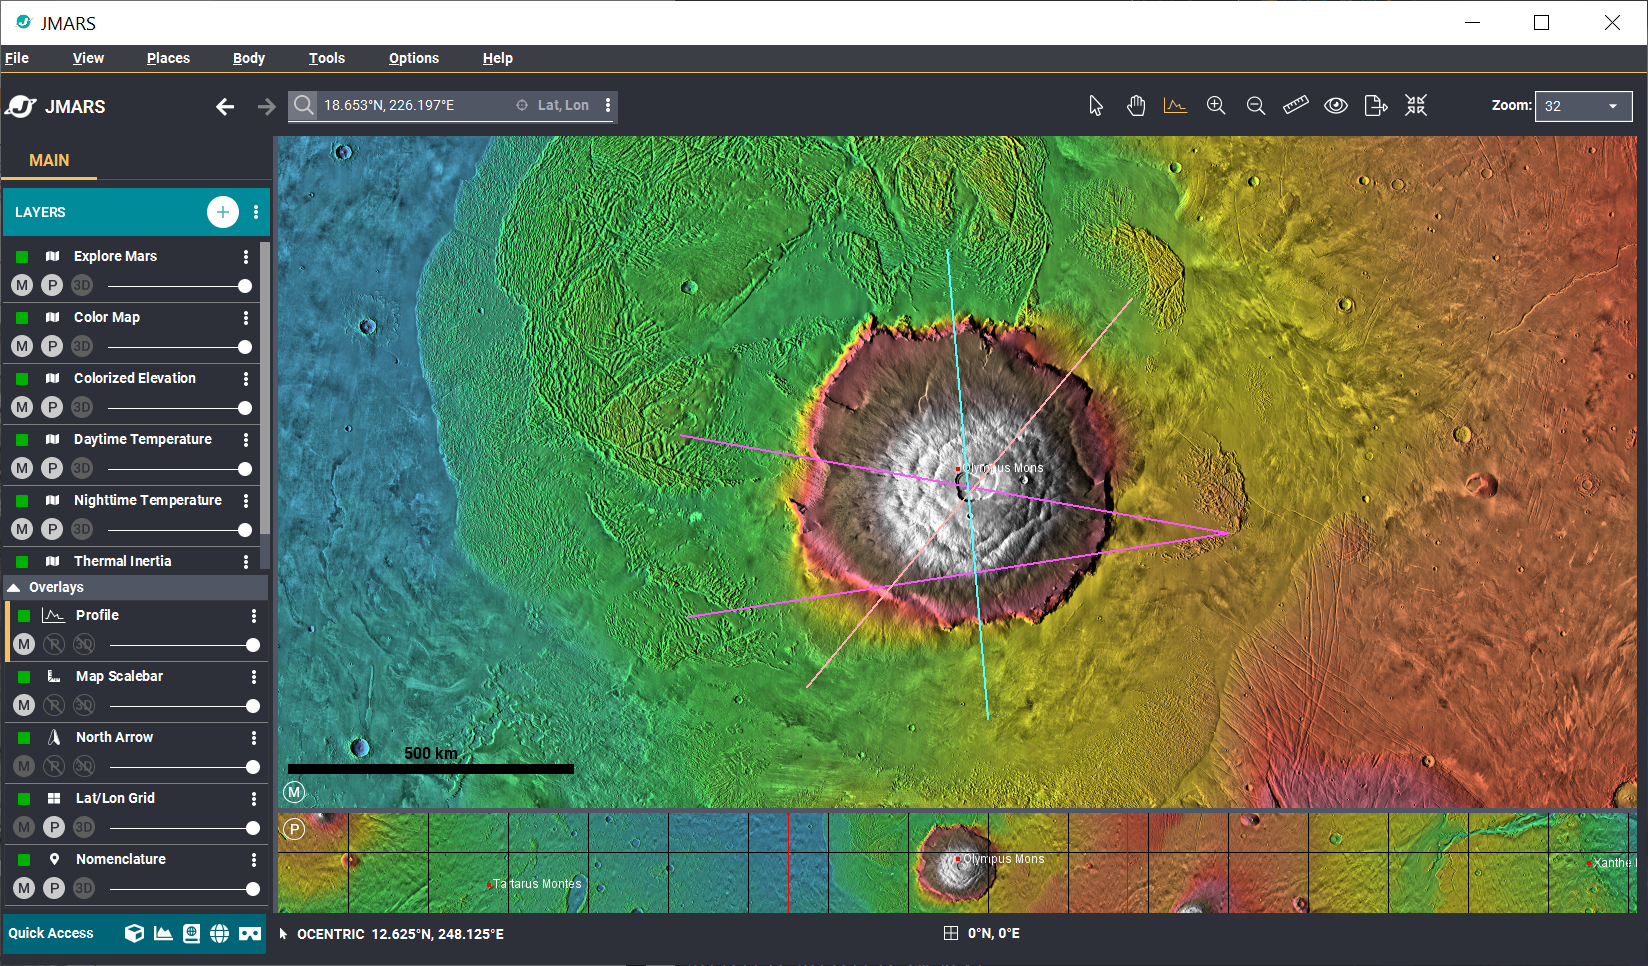
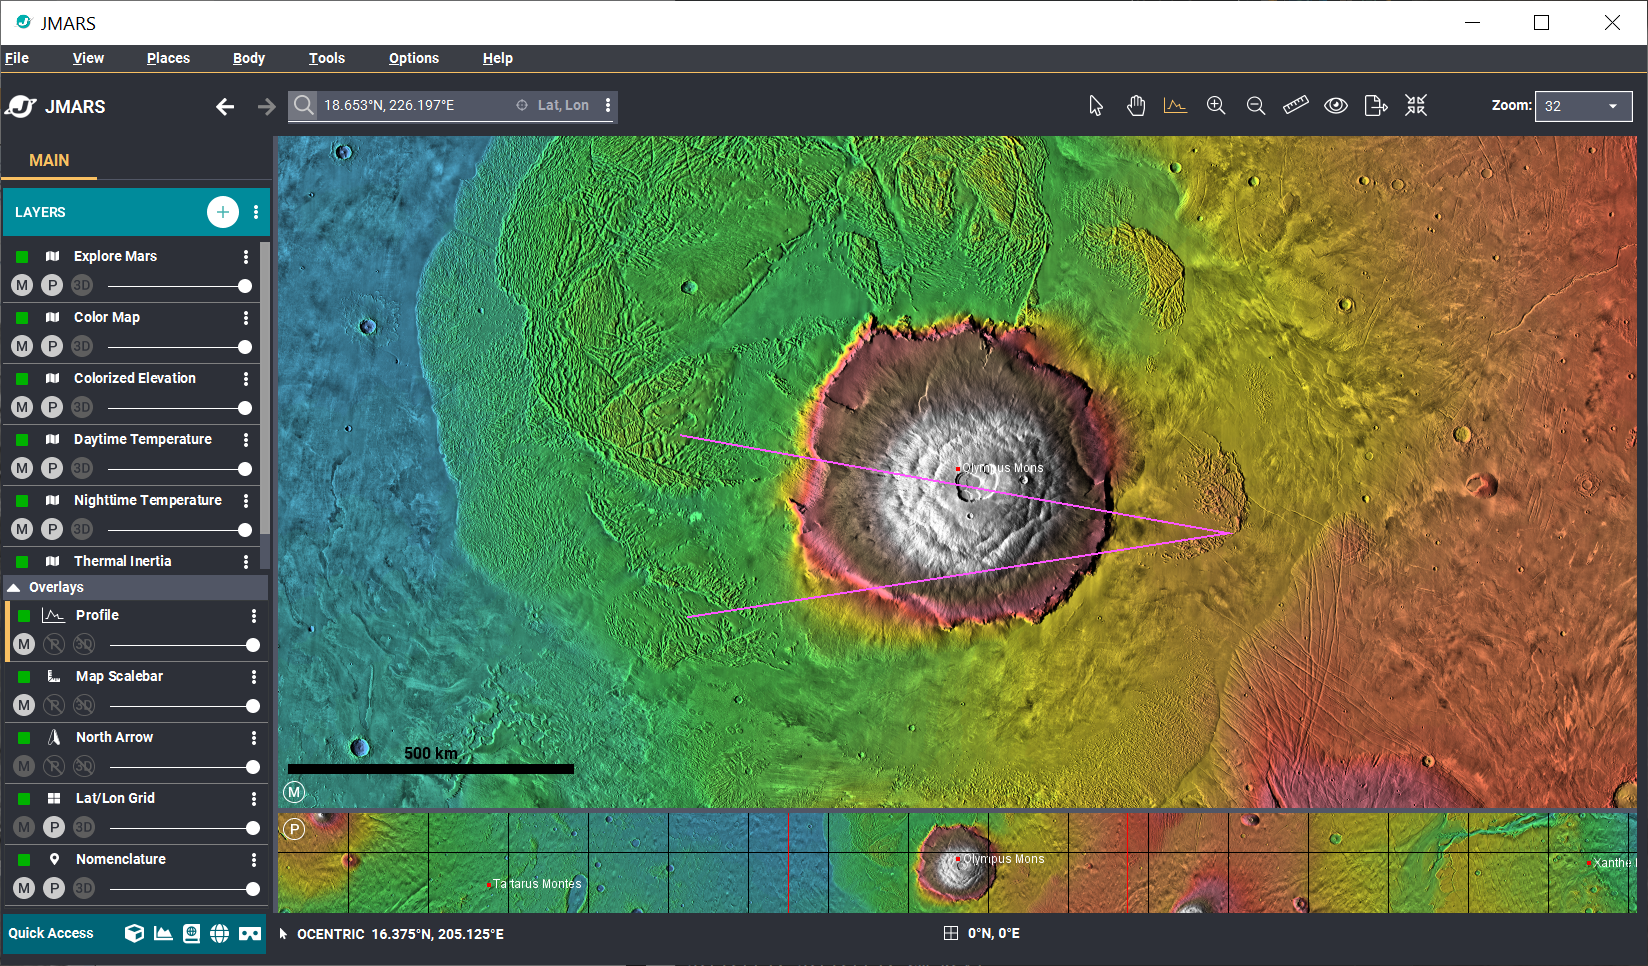
Activate the profile layer:
- Open the Advanced Profile Layer:
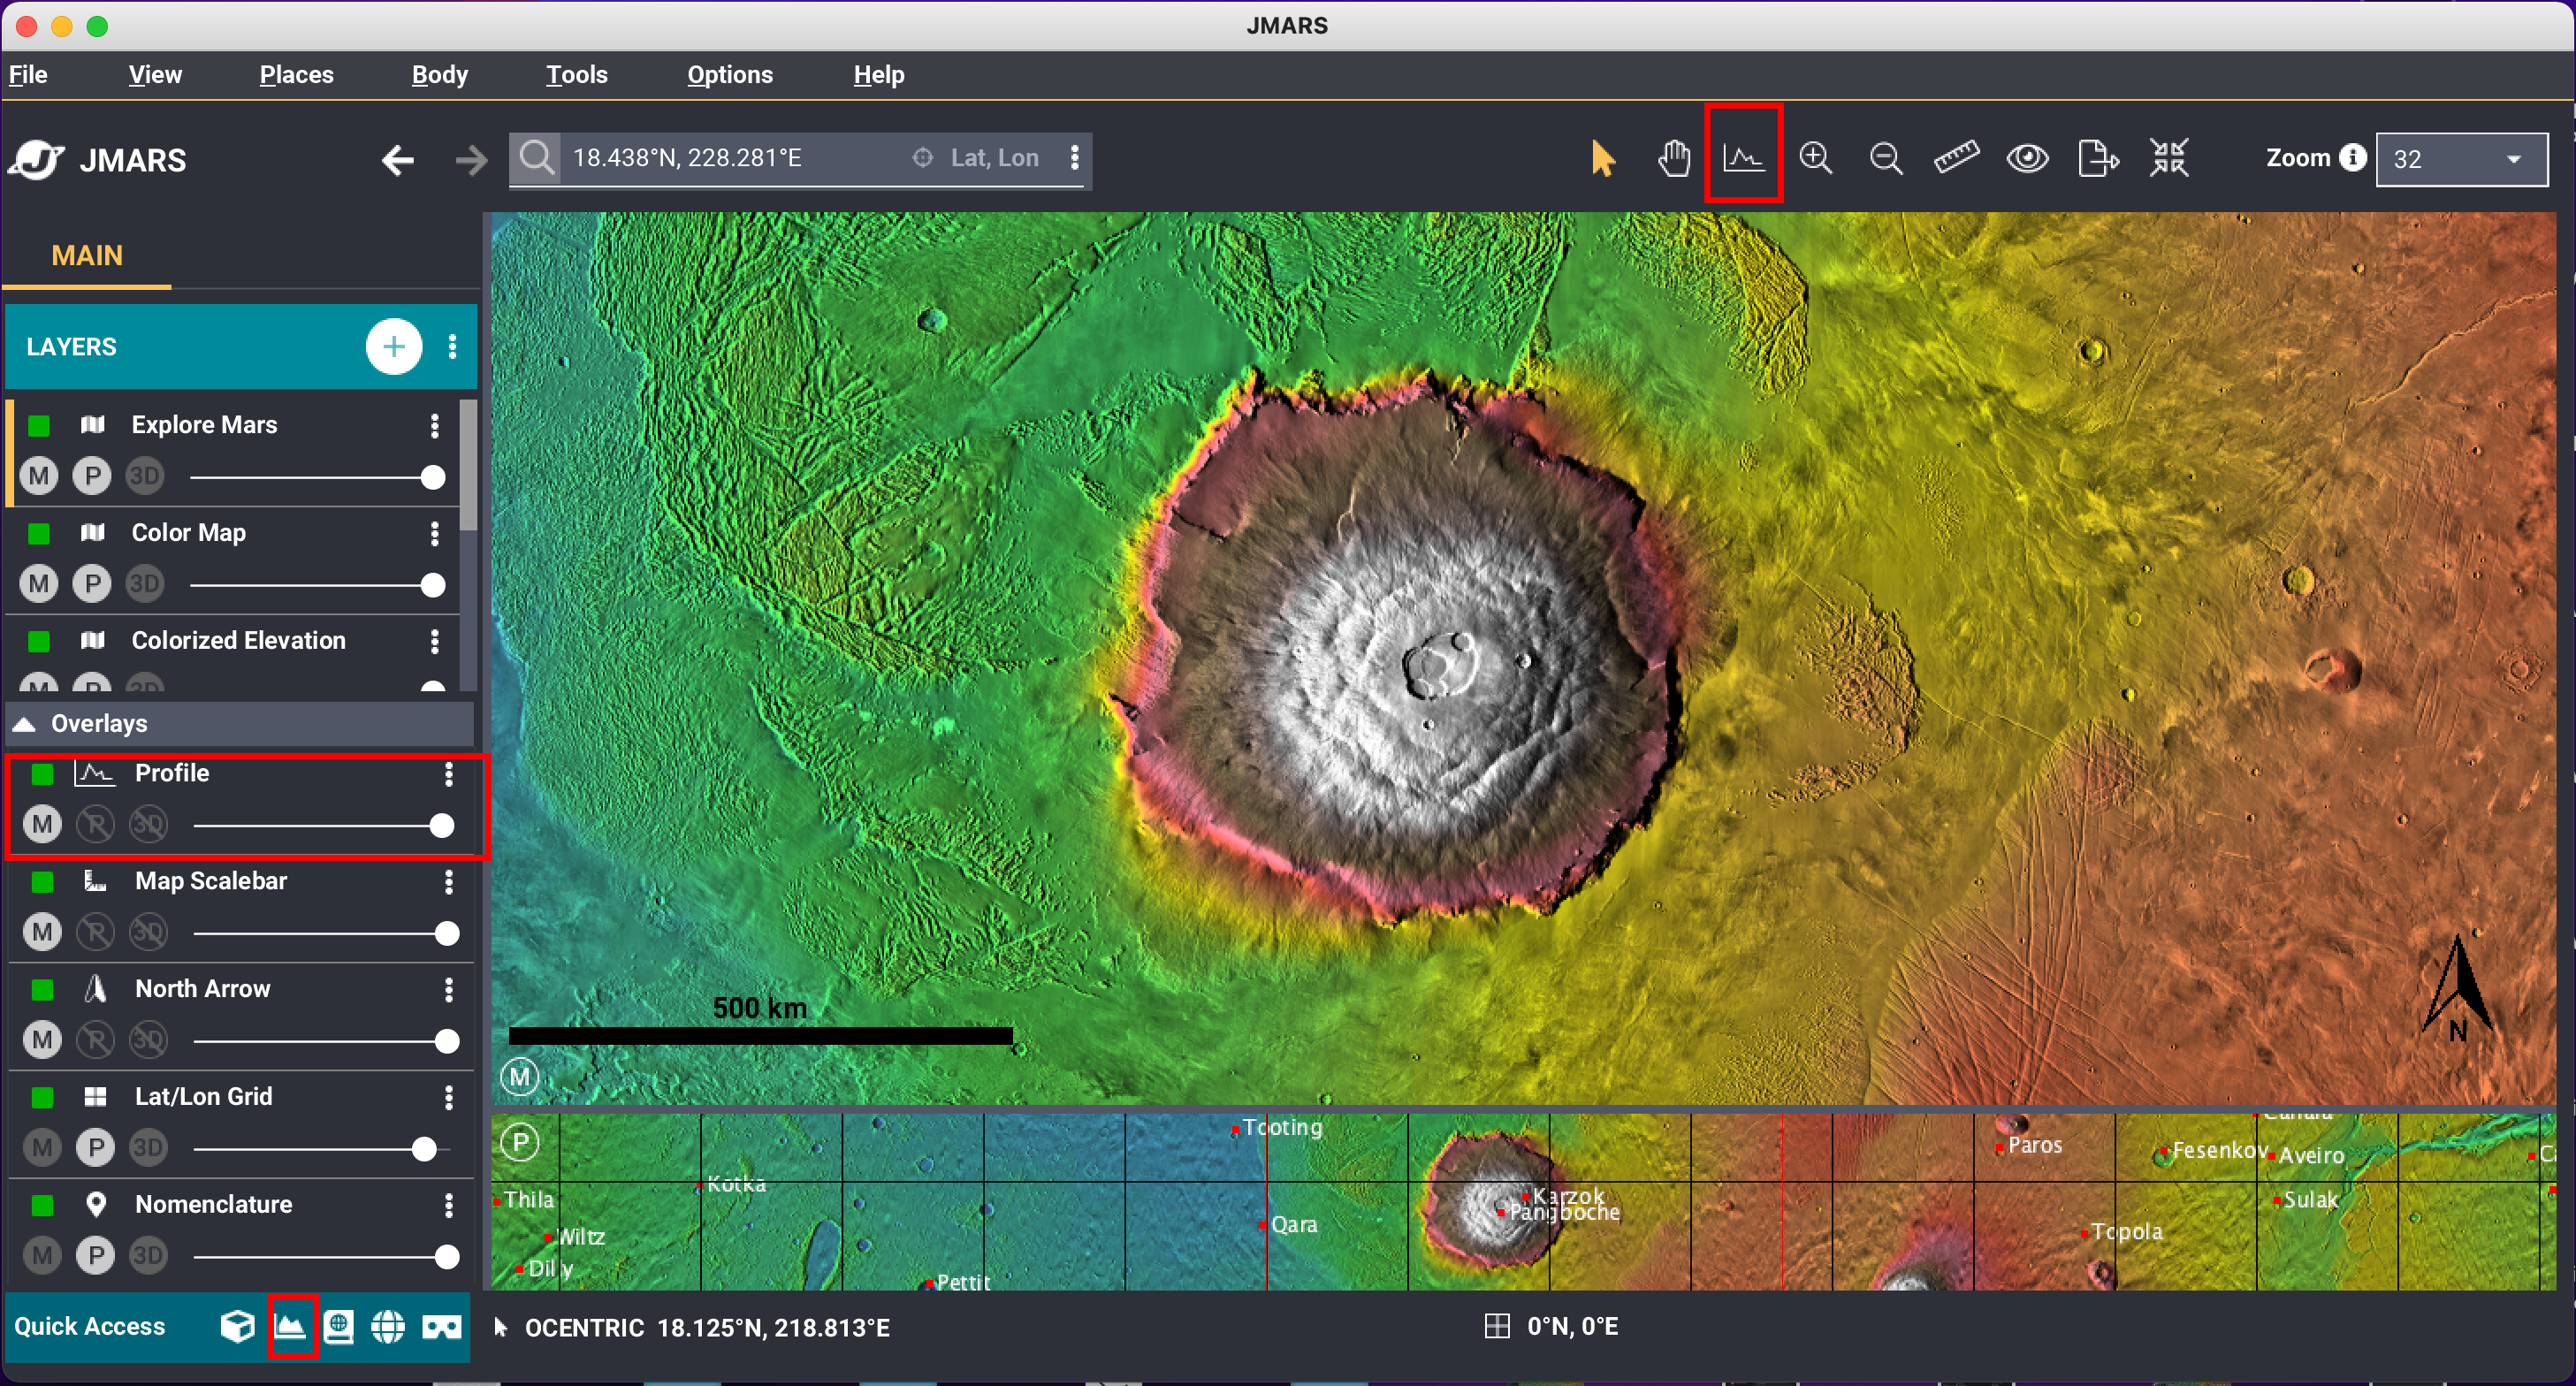
- The profile line layer is always in the "Overlay" section of the layer manager.
- There are 3 areas to access the profile line. The layer in the overlay section allows configuration of lines, such as name changes, and colors. The profile icon in the toolbar allows profile lines to start being drawn. The profile line icon in the quick access toolbar allows users to view the profile lines, change numeric sources and more.
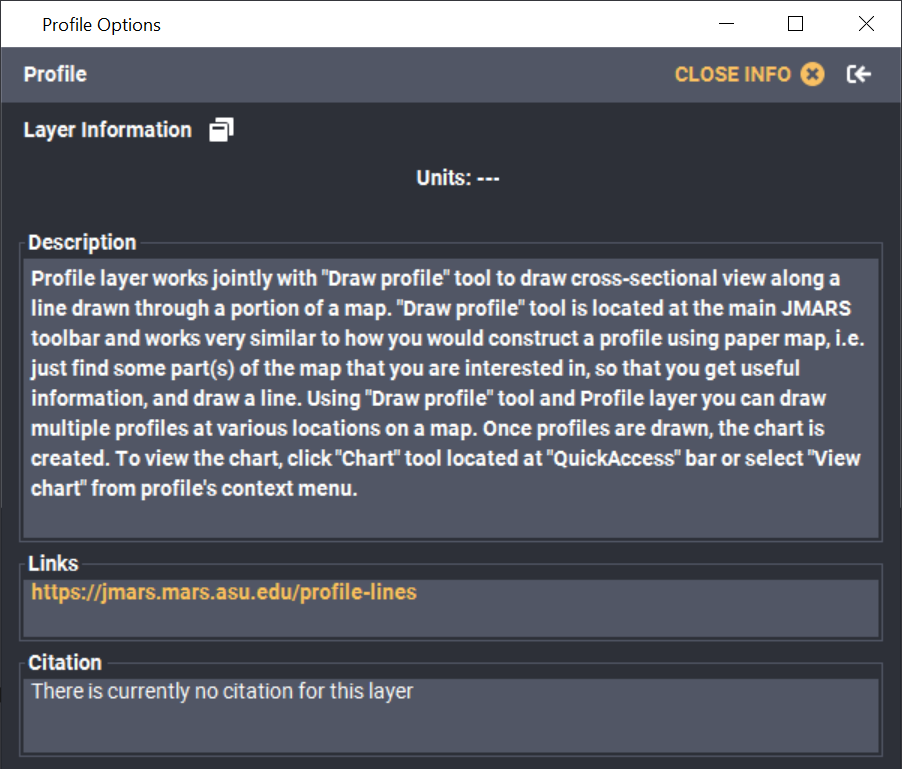
- Click on the profile layer to view the info panel before we draw any profiles. (make sure the "i" is selected at the top right of the info panel to see profile information)
- Close the info panel and activate the profile line tool by clicking on the profile line tool in the toolbar.
- Draw a profile line:
- To draw a line, move the cursor to the main view and click one time to continue the line and two times to end the profile line.
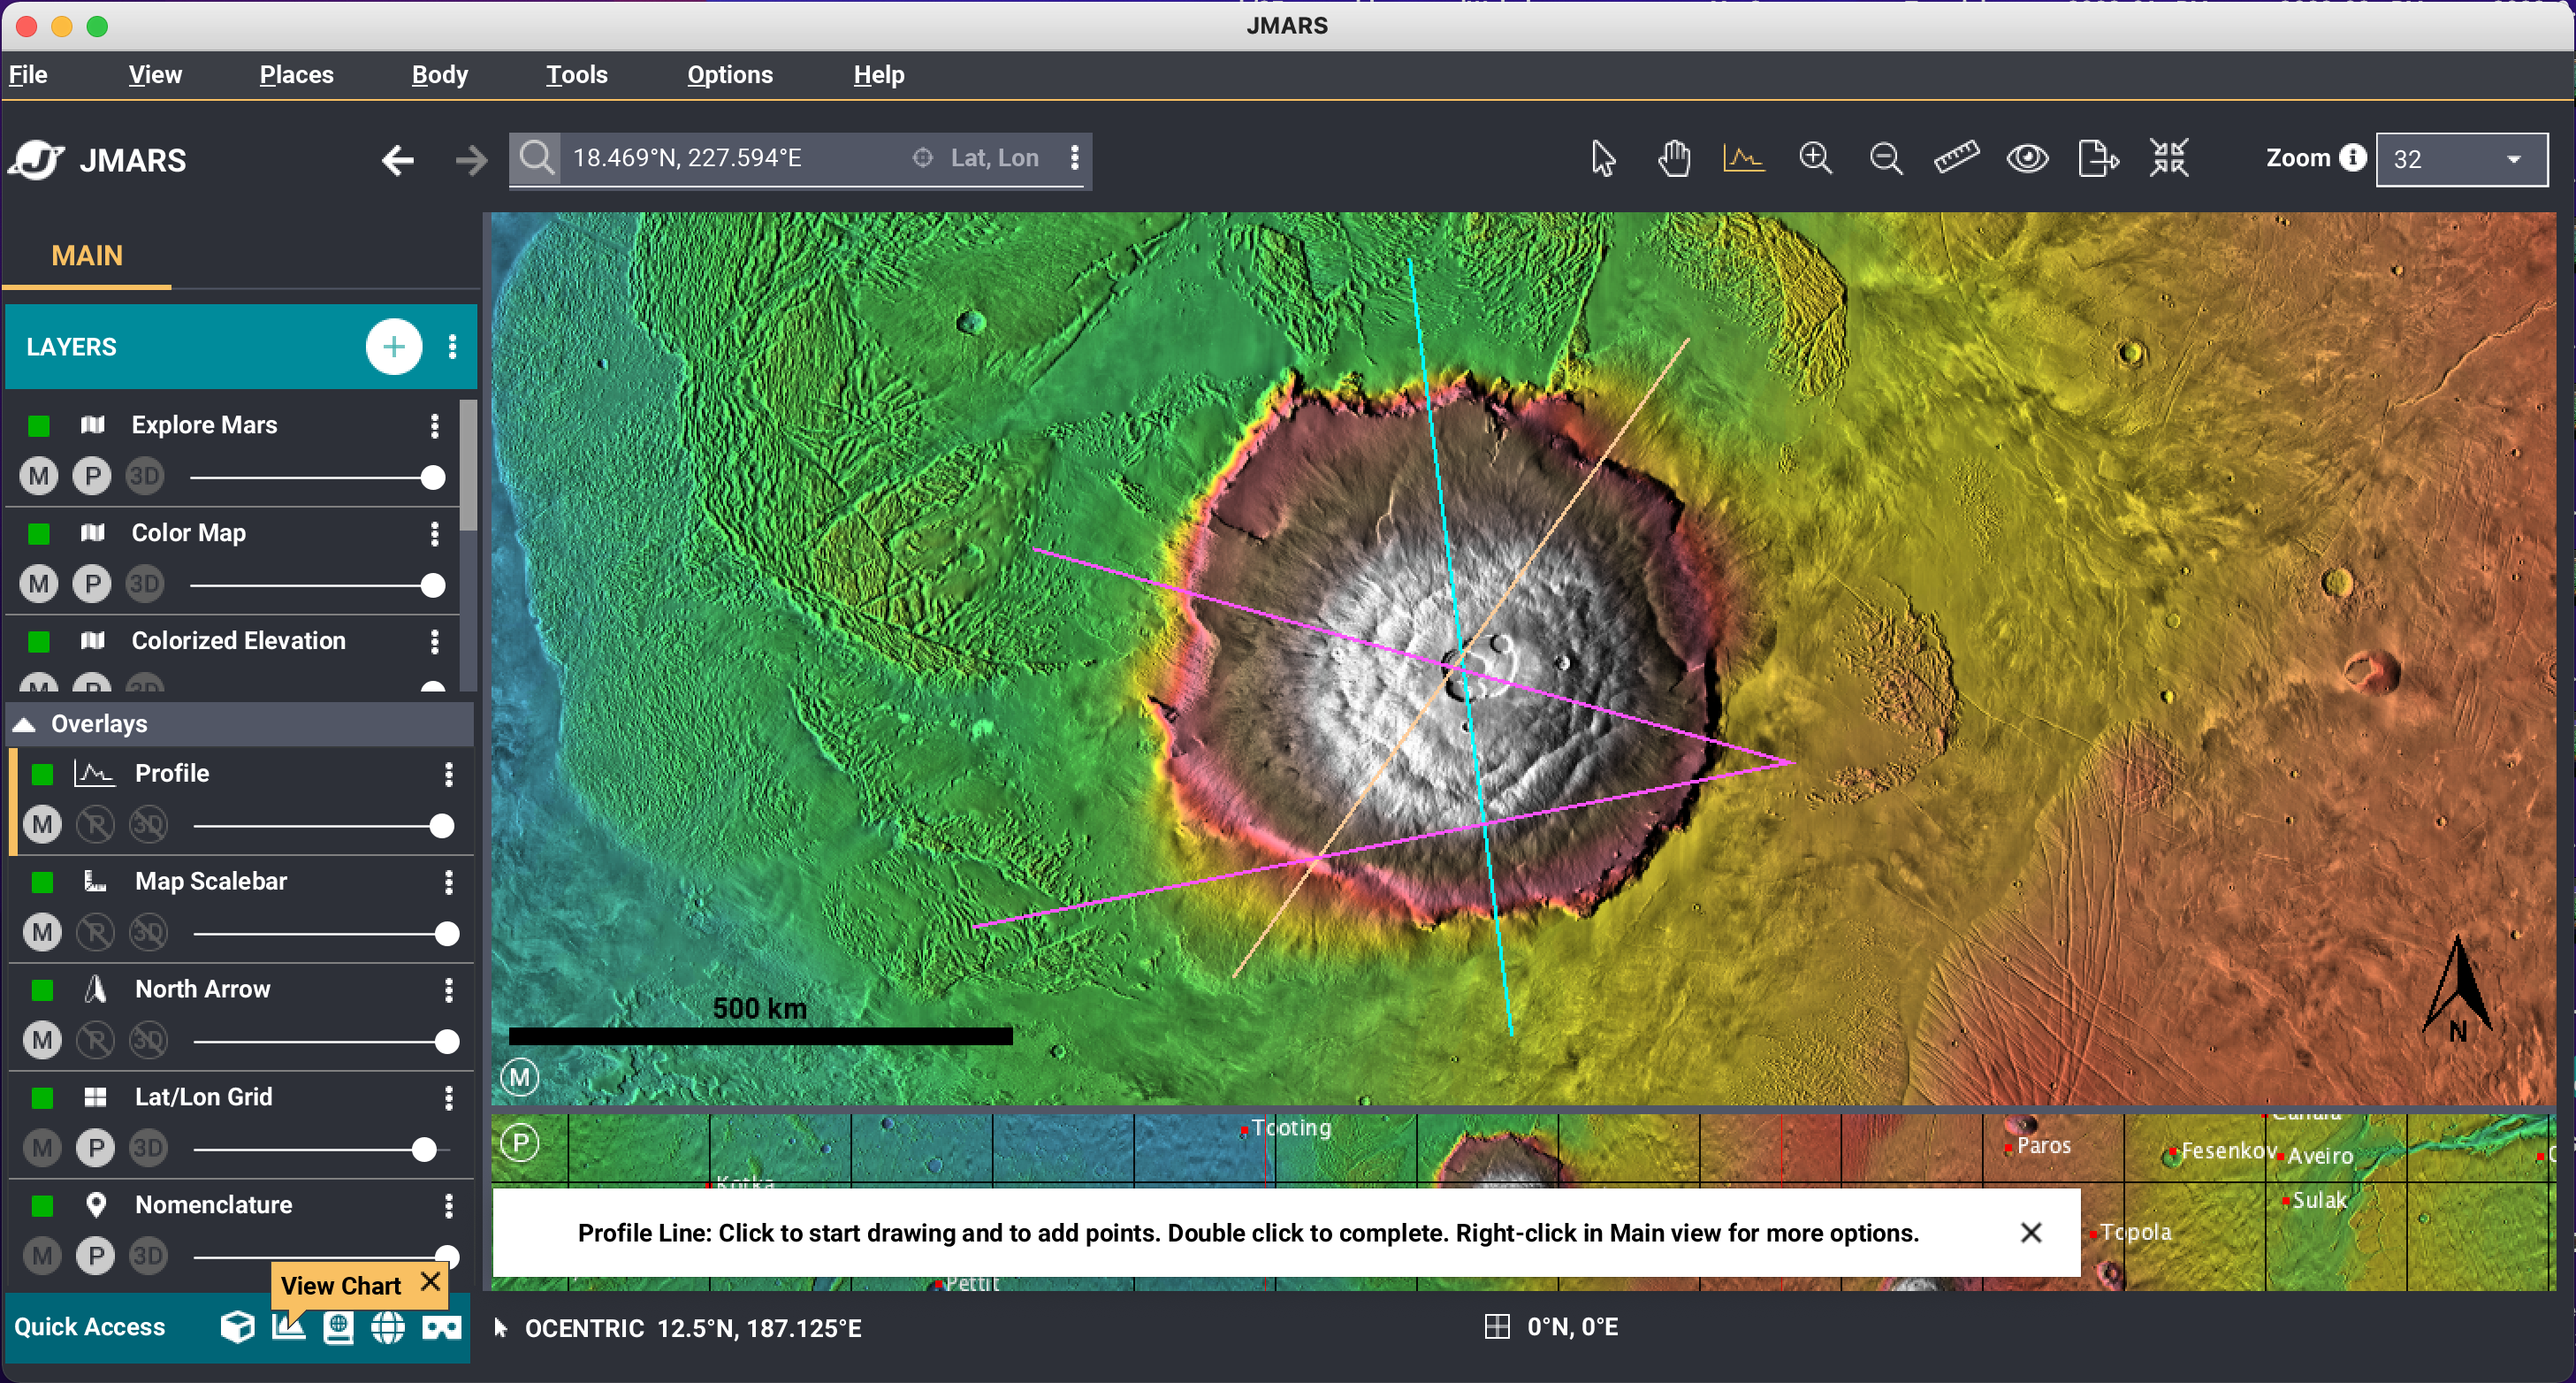
- Draw multiple lines in the mainview, each line should show as a different color.
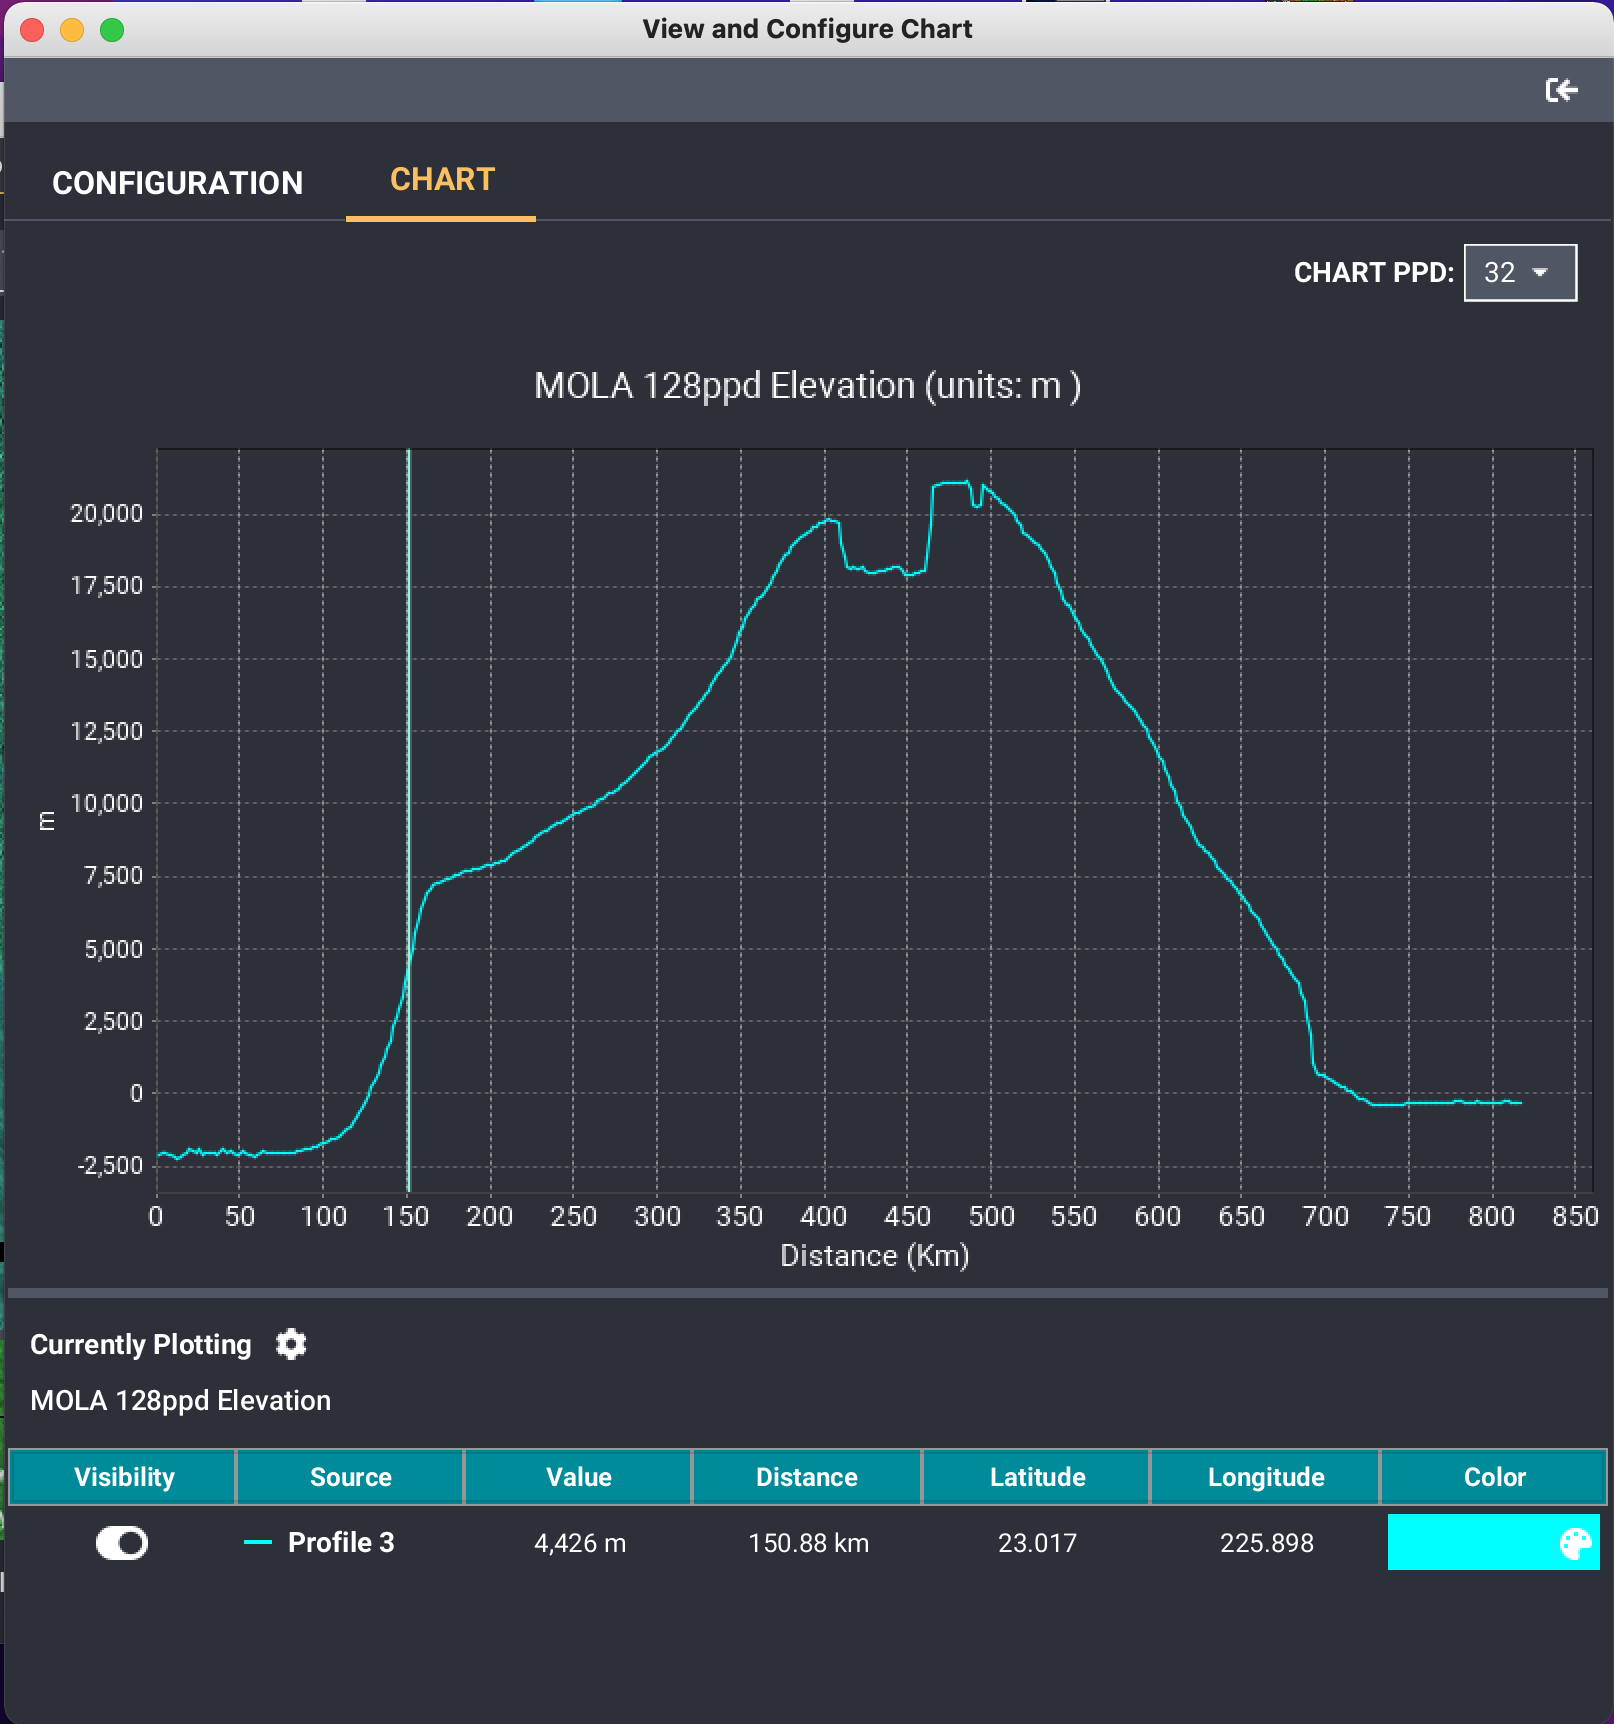
- To view the profile line, click the profile chart icon in the Quick Access panel. You should see a pop up that says, "View Chart".
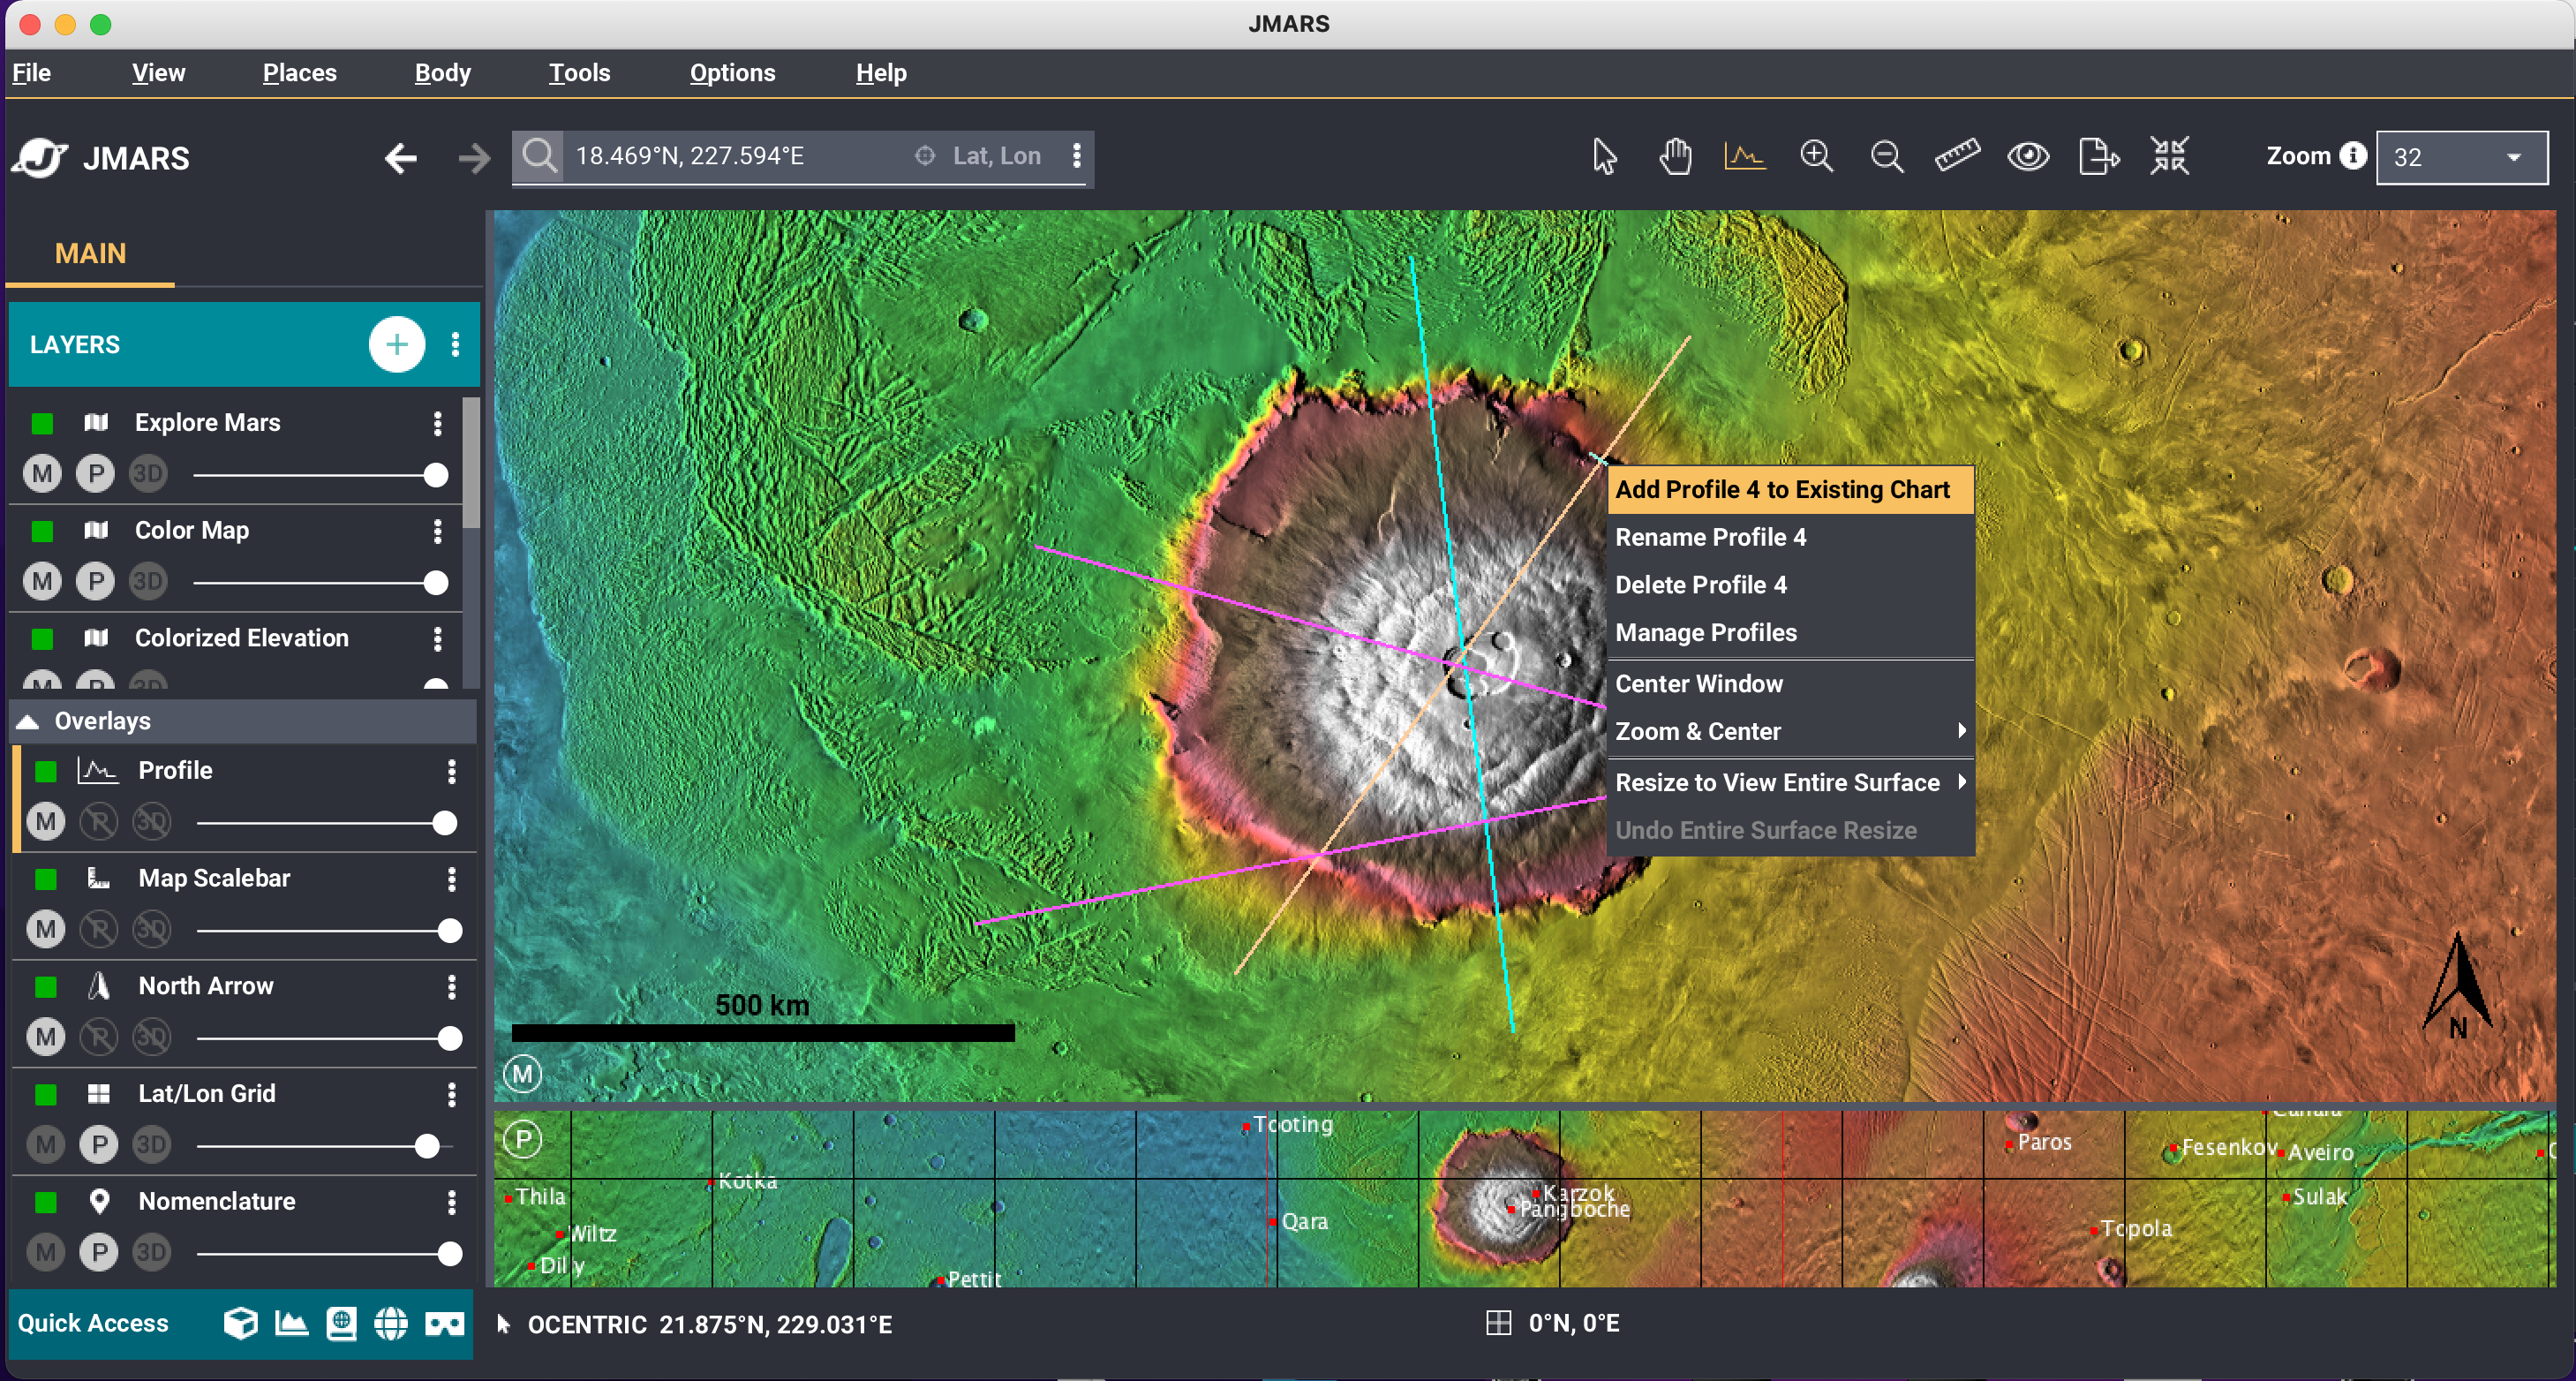
- You may notice that you only see the first profile line you drew. To add the other profile lines to the chart, right click each profile line on the main view and select, "Add Profile to Existing Chart".
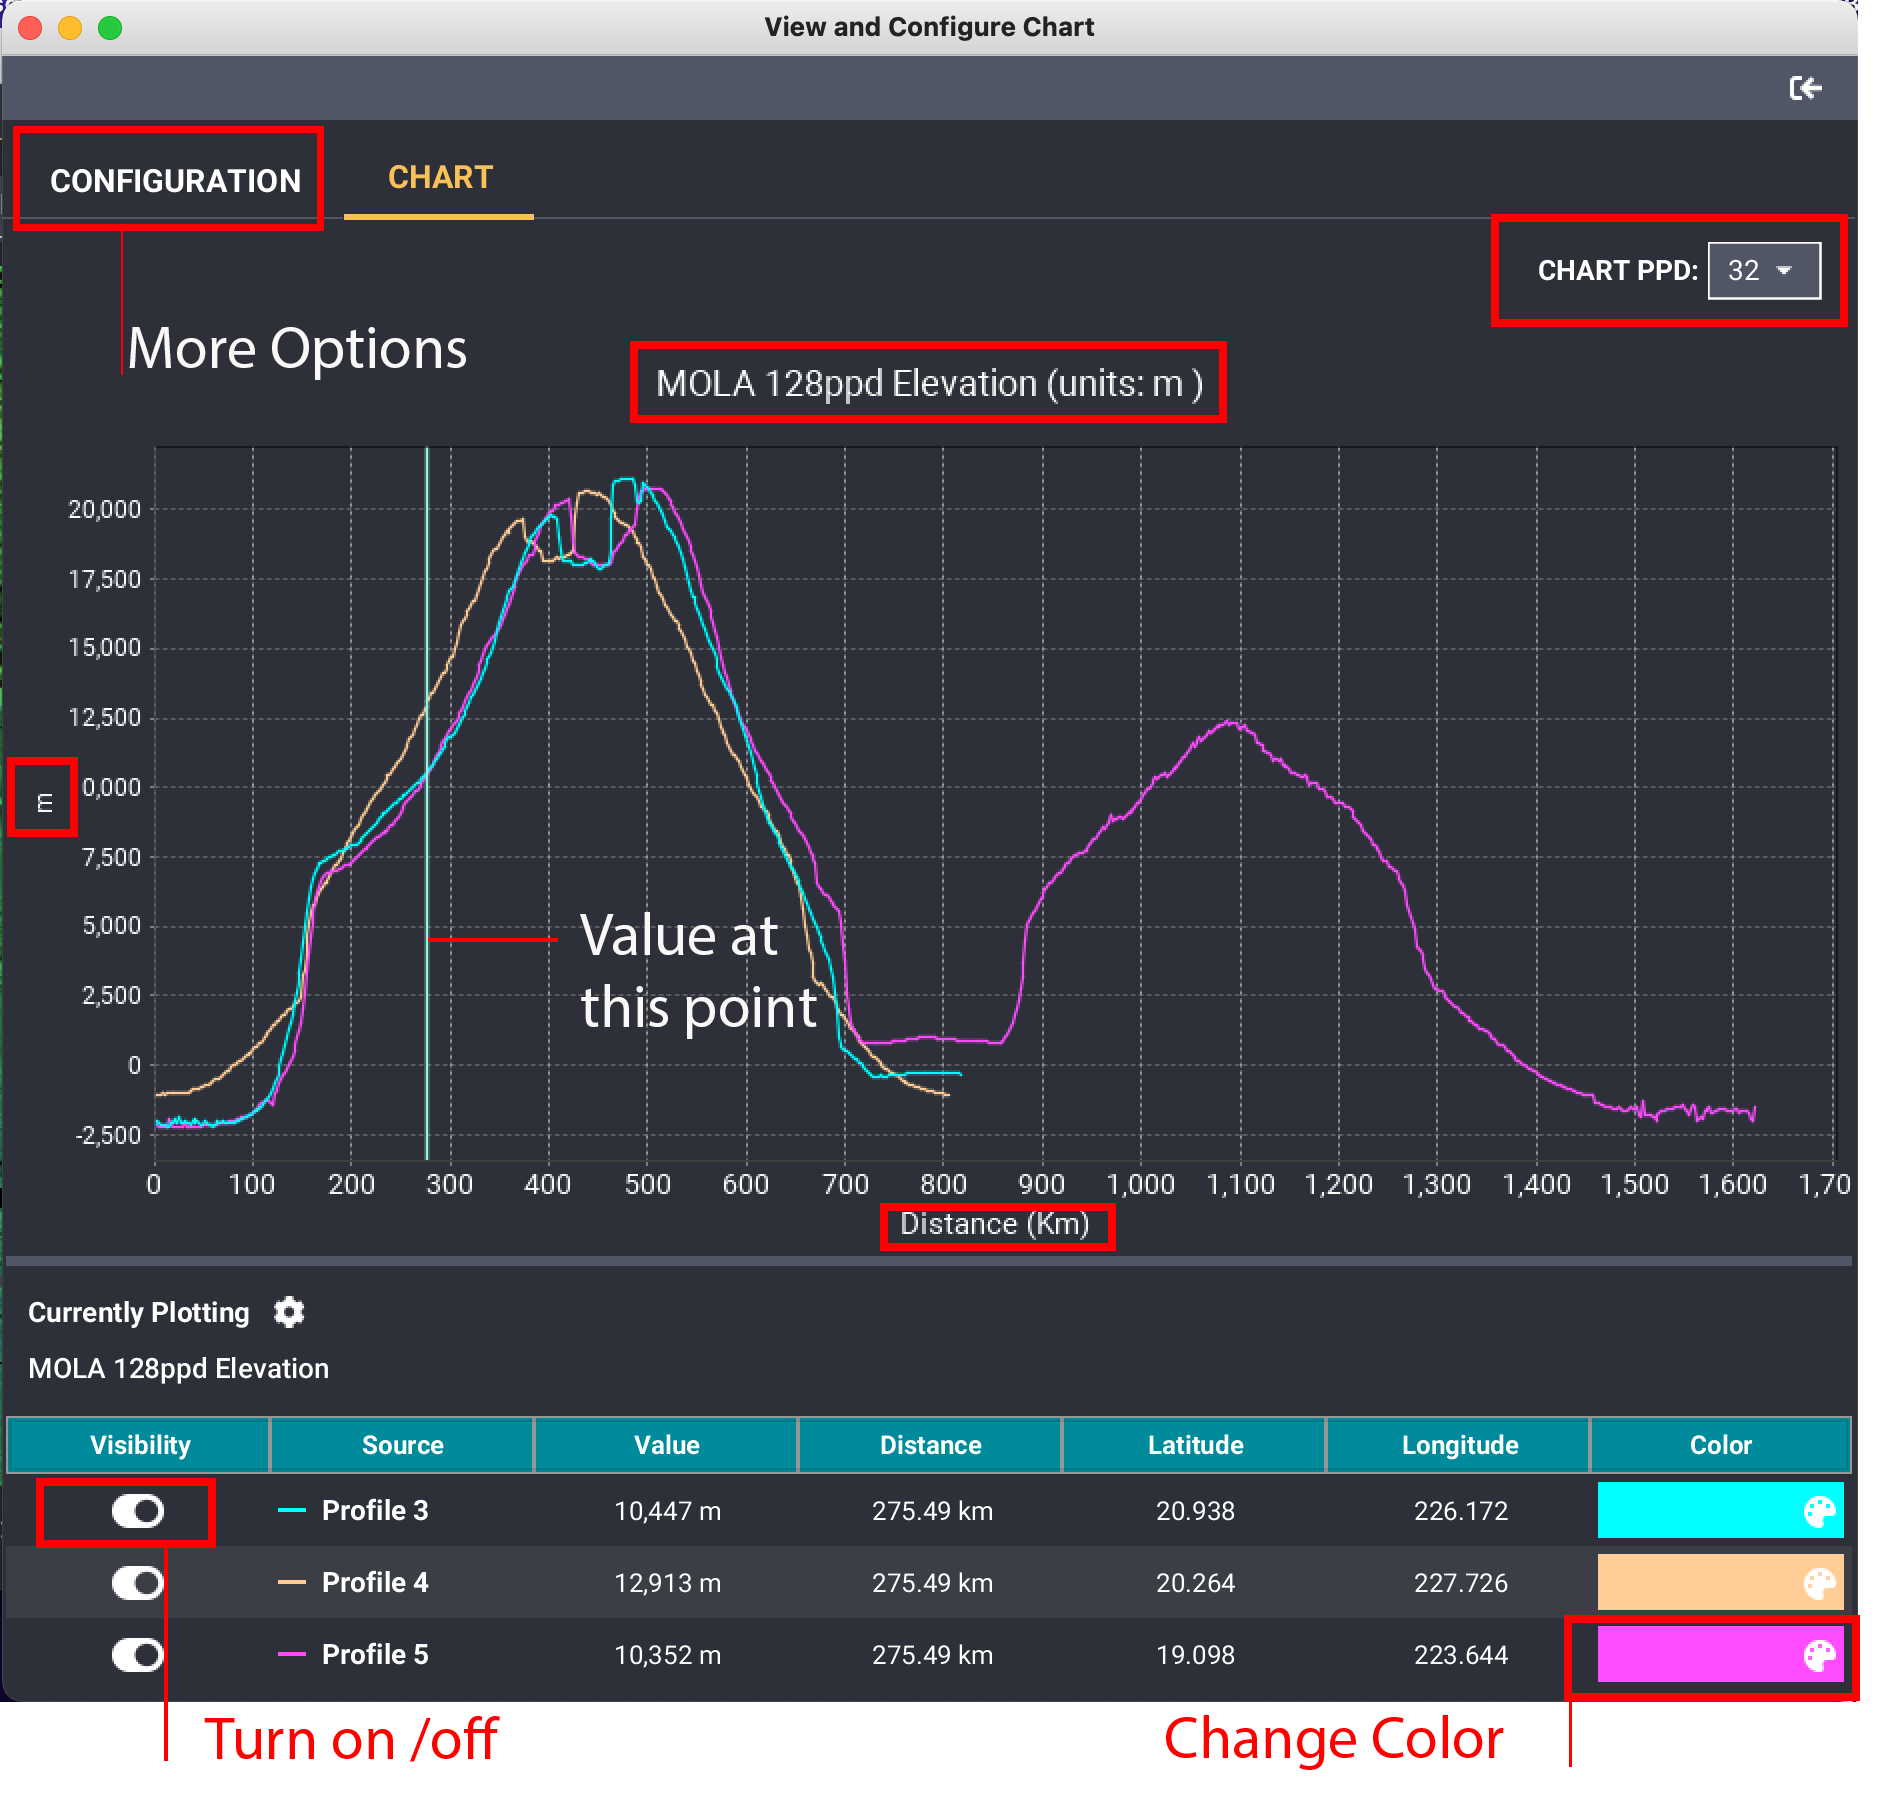
- The color of the line can be changed by selecting the desired profile row and clicking the color bar. This will open many colors to select from.
- The x and y axis is labeled with the units of the map.
- Profiles can easily be turned on and off with the "Visibility" button.
- Chart PPD can be easily changed with the drop down list in the top right hand corner.
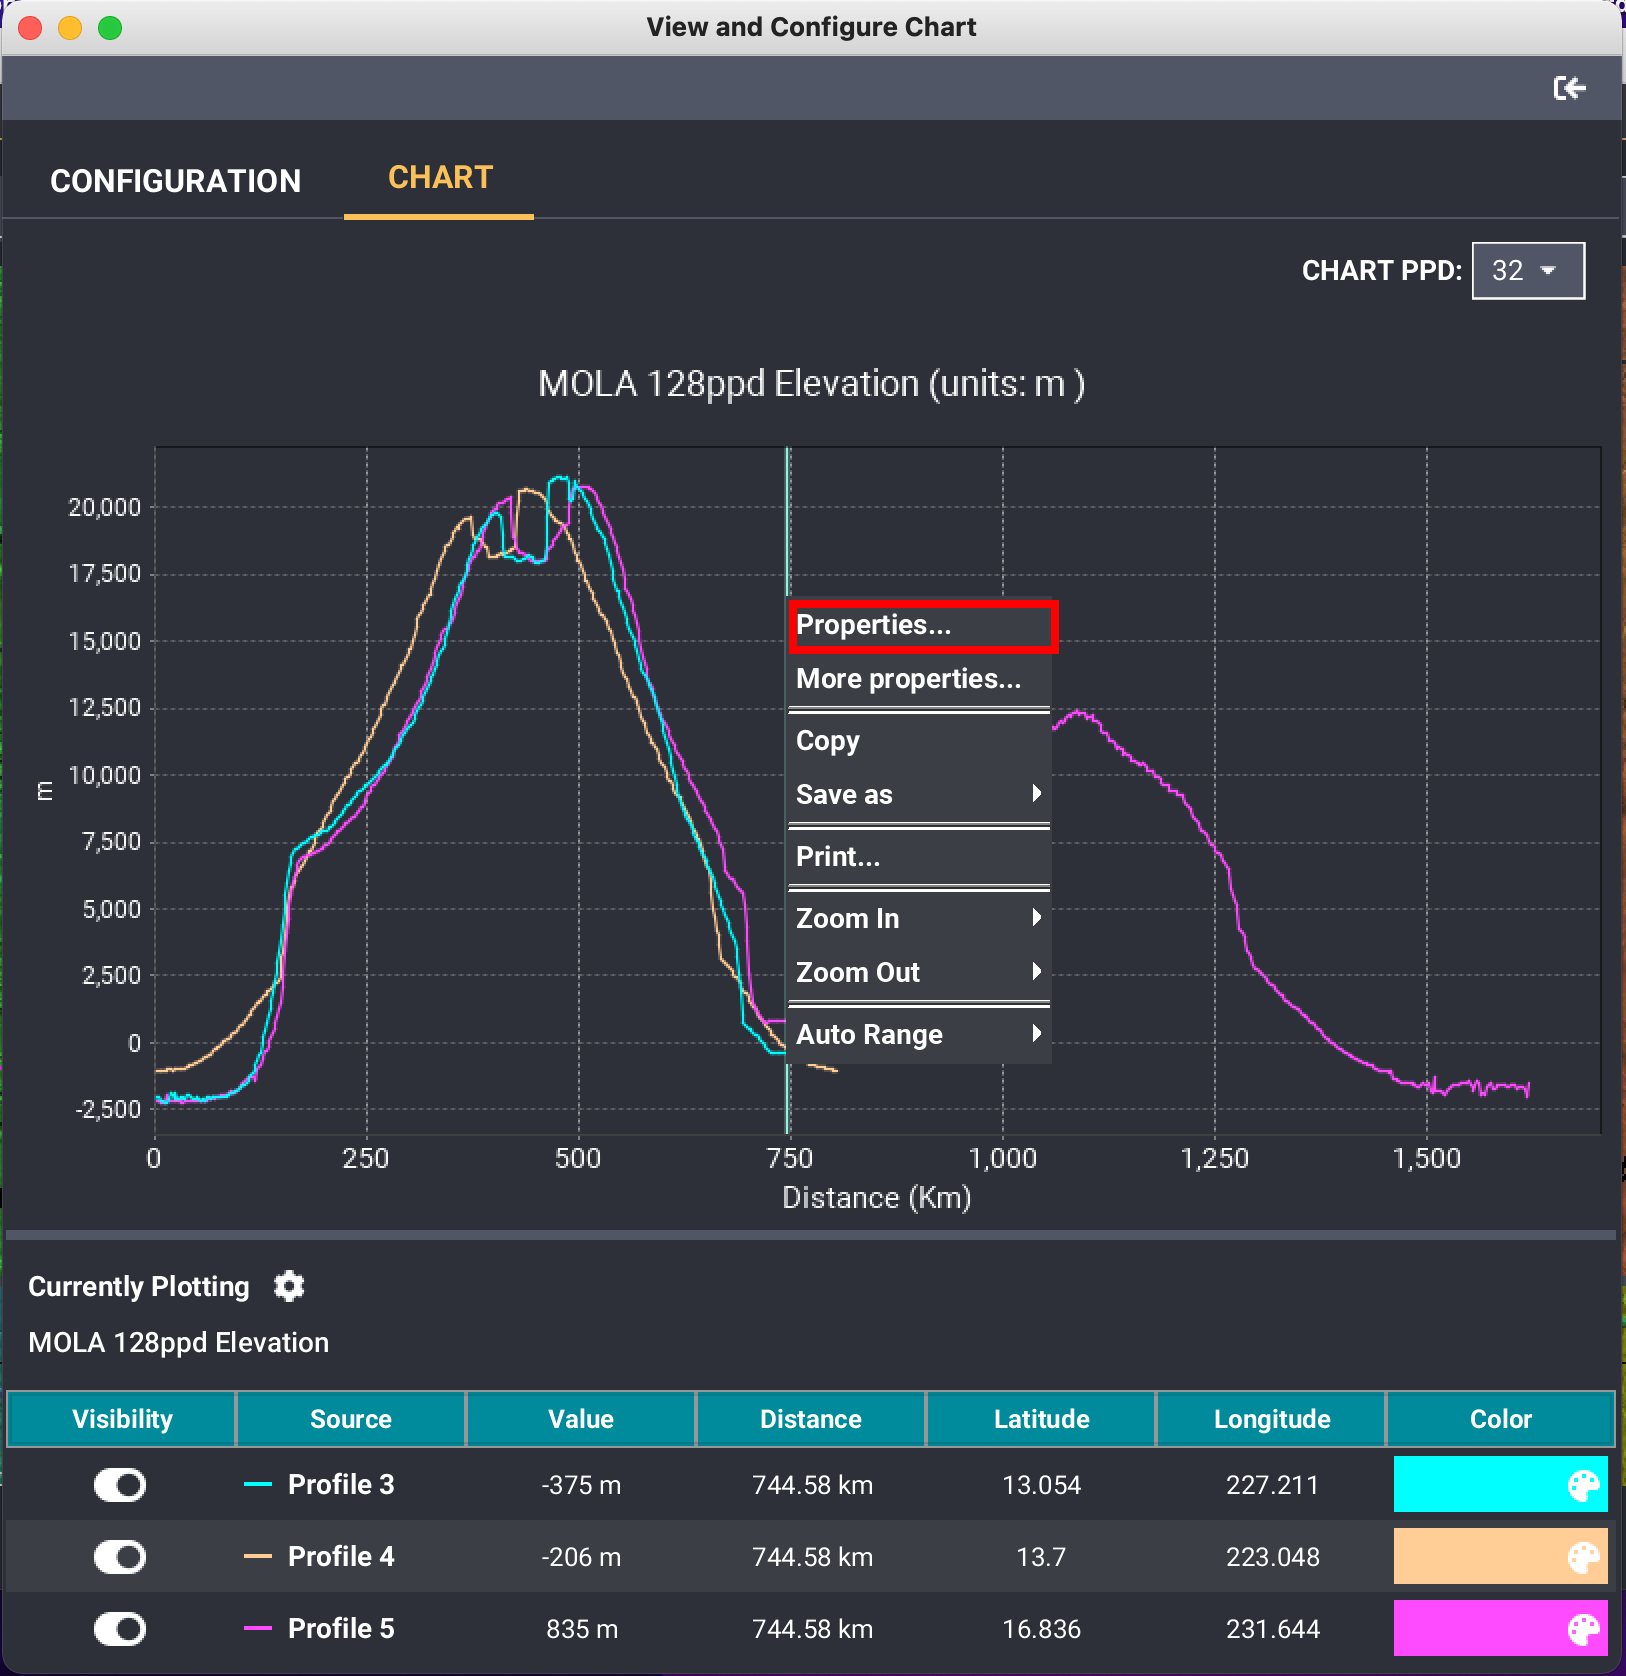
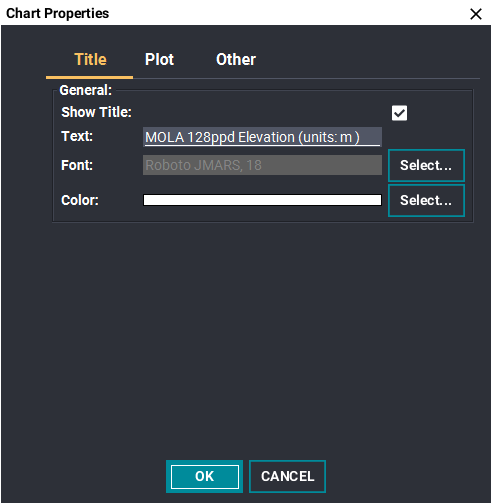
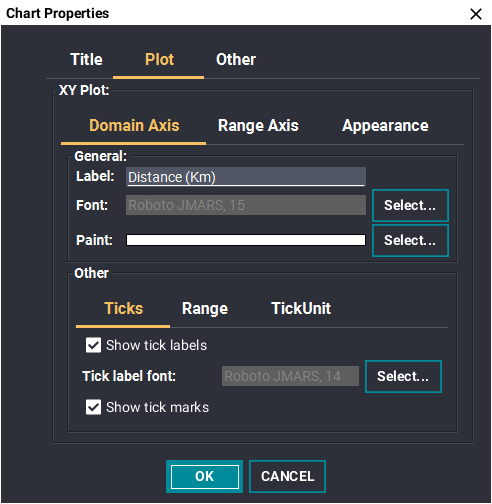
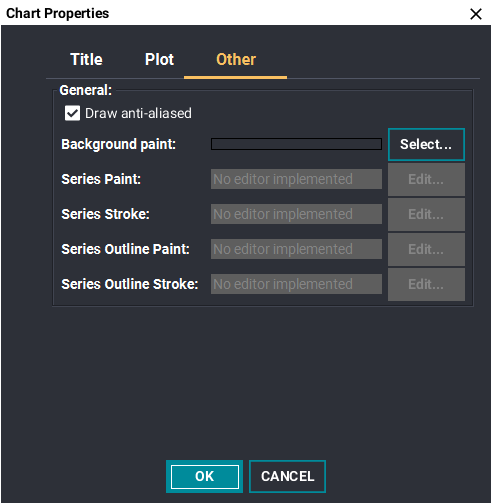
- The title, axis and many more can be edited by right-clicking the chart area of the window and selecting "Properties"
- This opens up another dialog with three different tabs. Each tab has additional options to personalize the profile line.
- Go back to the Chart View and click the "Configure" Tab.
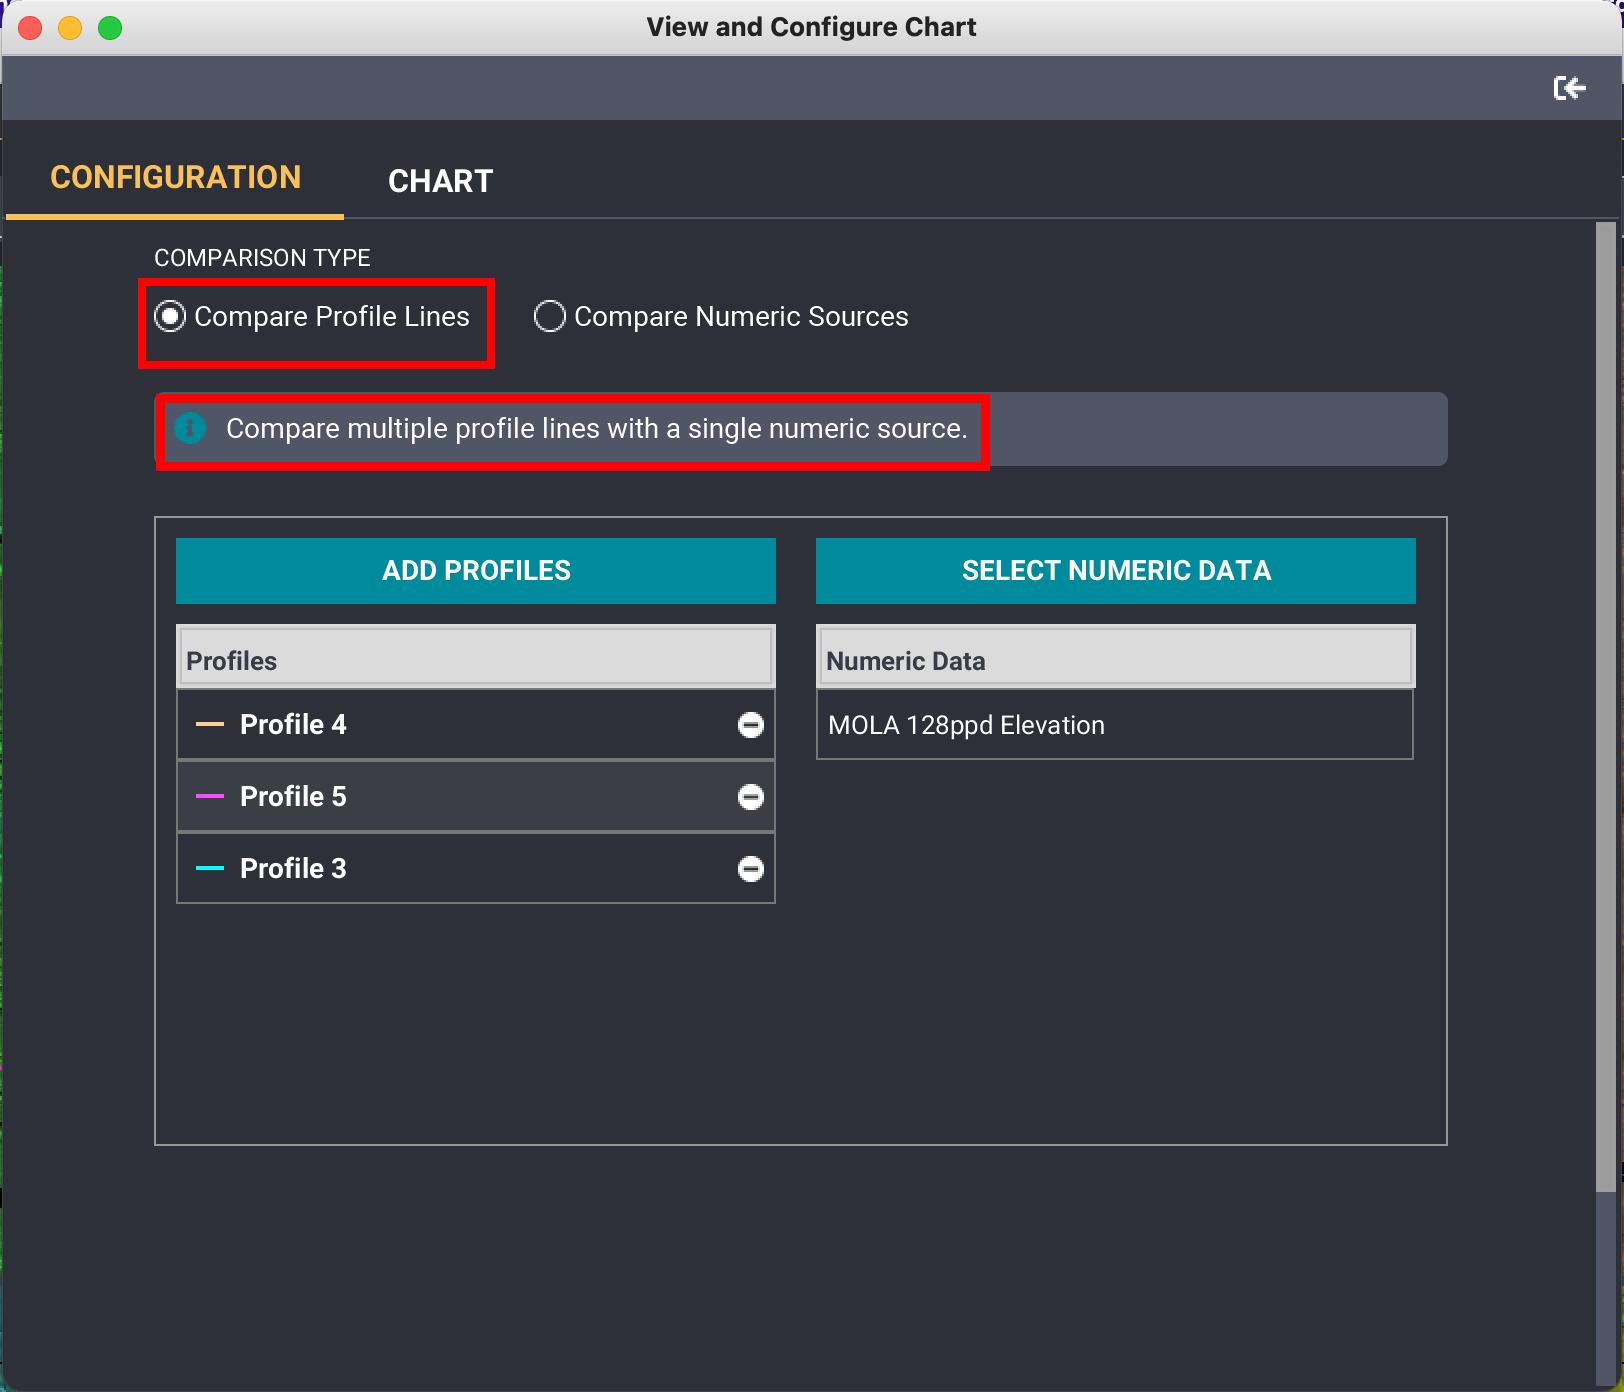
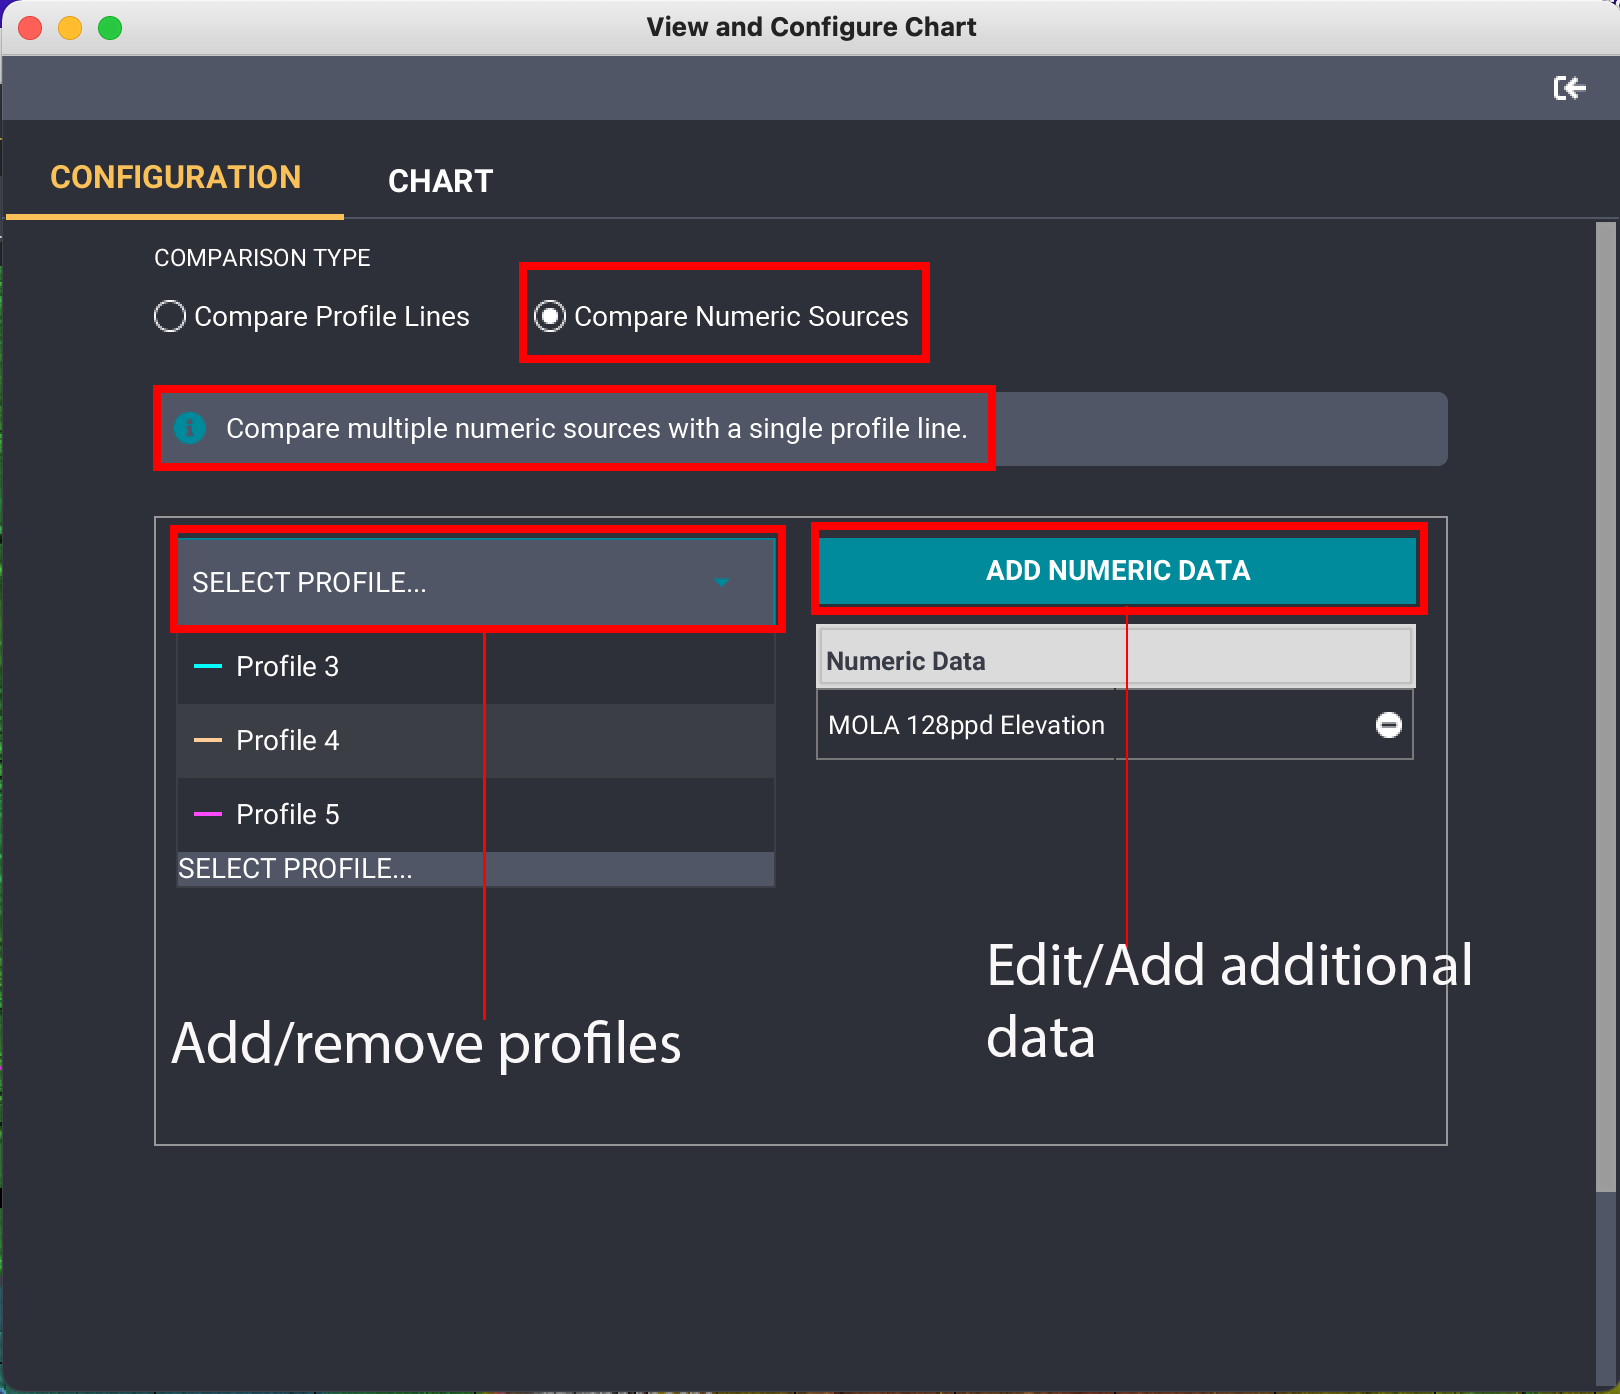
- The Configure tab allows the user to specify what numeric sources they would like to use and which profile lines to use. Here, you can select one of two charting options:
- Compare Profile Lines: Multiple profile lines can be charted at once, HOWEVER, only one numeric source can be used.
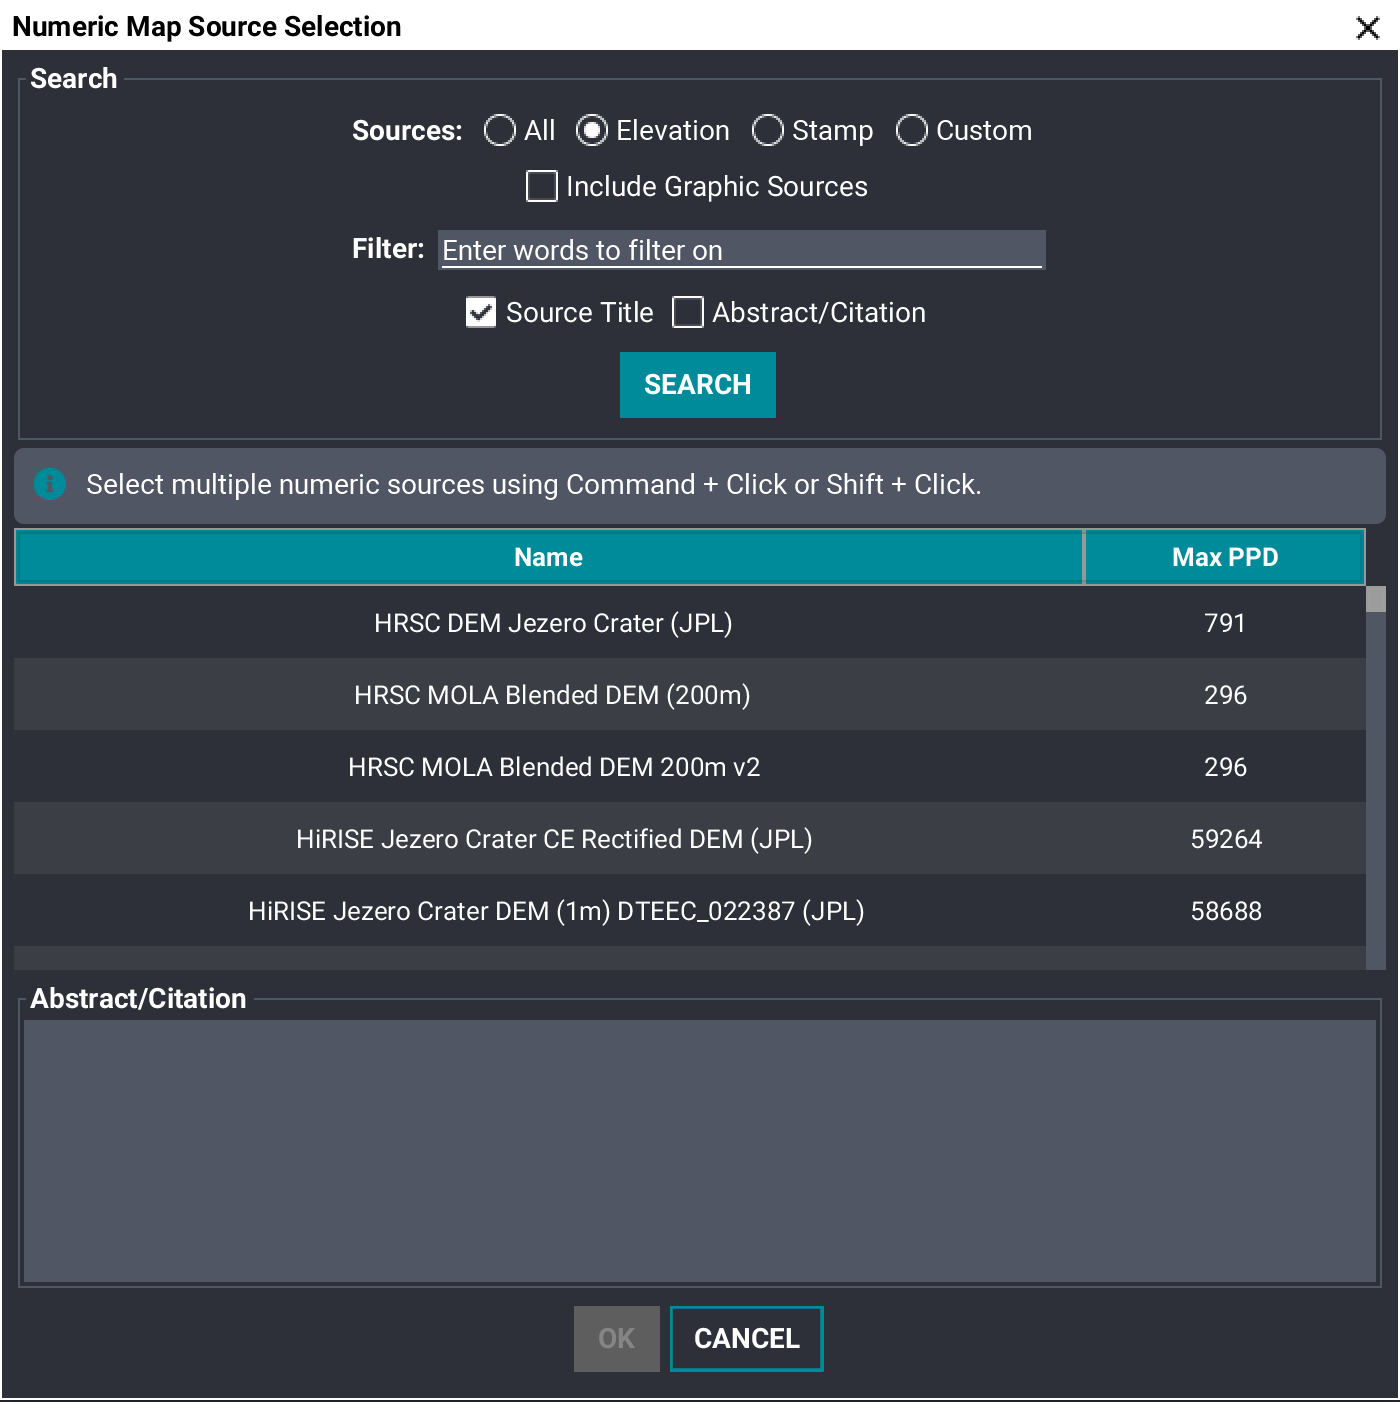
- Click the "Select Numeric Data" to change the map source.
- Compare Numeric Sources: Multiple numeric sources can be selected against 1 profile line. For example, elevation and slope can both be used as numeric sources against one profile line.
- Put the cursor near the profile line and right-click the profile line to get additional options.
- Then click, "Delete *profile Line name* ".

Edit/review the profile line:
Changing Map Sources and Profile Line Options

Delete Profile Lines:
